Exposure Summary
The Exposure Summary report generates a summary of subject exposure to experimental treatments by Treatment Group using data found in the Exposure (EX) domain. A subject-level summary of treatment exposure is also produced and displayed in a Swimmer Plot to show the change in treatments and dose over time. Knowledge of a subject’s exposure to treatment is important for a number of reasons:
| • | Subjects who are non-compliant to study treatment may have poorer response to efficacy endpoints. Depending on the underlying safety of the study treatment and the severity of disease, a subject’s safety profile could differ significantly depending on their compliance to study treatment. |
| • | Notable differences in compliance between Treatment Groups could be an indication of poor tolerance among some Treatment Groups, and this poor compliance could potentially be unmasking of the treatments individual subjects are taking. |
| • | Interruptions in daily medications or inconsistent gaps for less-frequent dosing schedules can identify compliance issues to the protocol and could lead to safety issues or poor efficacy responses. |
Because subject dosing can be summarized in the EX domain in numerous ways, Exposure Summary makes significant effort to summarize the total dose taken for each Treatment (EX.EXTRT) on each and every observed date for each and every subject. Not only does this make it possible to compute periods of consistent dosing for each Treatment, but it allows the computation for the frequency and length of gaps, as well as the overlap of multiple treatments that may be taken on the same date. Exposure Summary also presents Treatments that were inadvertently taken, such as when dosing errors occur at the site.
Definitions
Before we proceed, we must define a consistent language for discussing exposure and describing the contents of Exposure Summary.
| 1. | Duration of Exposure: This is the last date of Treatment minus the first date of Treatment + 1 day. It represents the length of time in days a subject took a particular Treatment, including any interruptions or gaps in time where a subject did not take a Treatment for non-daily Treatments. |
| 2. | Total Dose of Treatment: The total amount of Treatment taken over the entire study. |
| 3. | Average Daily Dose Over the Duration of Exposure: Total Dose of Treatment/Duration of Exposure. |
| 4. | Frequency of Days Receiving Treatment: The number of days a subject took one or more doses of a Treatment. Note how this is distinct from Duration of Exposure defined above. For example, if there is a 3 month study where a subject is dosed once a month, then Duration of Exposure would be considered 3 months while Frequency of Days Receiving Treatment would be 3. |
| 5. | Percent of Duration Days Receiving Treatment: Frequency of Days Receiving Treatment/Duration of Exposure × 100. |
| 6. | Average Daily Dose Over the Days Receiving Treatment: Total Dose of Treatment/Frequency of Days Receiving Treatment. |
| 7. | Dosing Gap: One or more days when a subject did not take at least one dose of a Treatment between two dates where at least one dose of the Treatment was taken. For daily Treatments, Dosing Gaps are typically thought of as Treatment Interruptions. For non-daily Treatments, Dosing Gaps of approximately the length of the dosing schedule (say, 7 days for a weekly Treatment or 30 days for a monthly Treatment) are expected. However, improper dosing may show excessively long or excessively short Dosing Gaps. Note that Exposure Summary makes no distinction between daily or non-daily Treatments. All Dosing Gaps between successive Treatment Days are computed and summarized. Note that Dosing Gaps can only be considered between the first and the last date where at least one dose was taken. As such: |
| • | Treatment Durations of a 1-2 days cannot experience a Dosing Gap. |
| • | If a subject discontinues treatment early, the number of days between the last dose and the date the subject should have stopped treatment is not considered a Dosing Gap. Currently, Exposure Summary does not compute summary statistics or display the time between the observed last dose and idealized last dose dates. |
| 8. | Frequency of Dosing Gaps: The frequency of distinct Dosing Gaps, with each gap of at least one day duration. |
| 9. | Min(Duration of Dosing Gap (Days)): The minimum or smallest observed Dosing Gap length (in days) for a subject. |
| 10. | Median(Duration of Dosing Gap (Days)): The median or average observed Dosing Gap length (in days) for a subject. |
| 11. | Max(Duration of Dosing Gap (Days)): The maximum or largest observed Dosing Gap length (in days) for a subject. |
Report Results Description
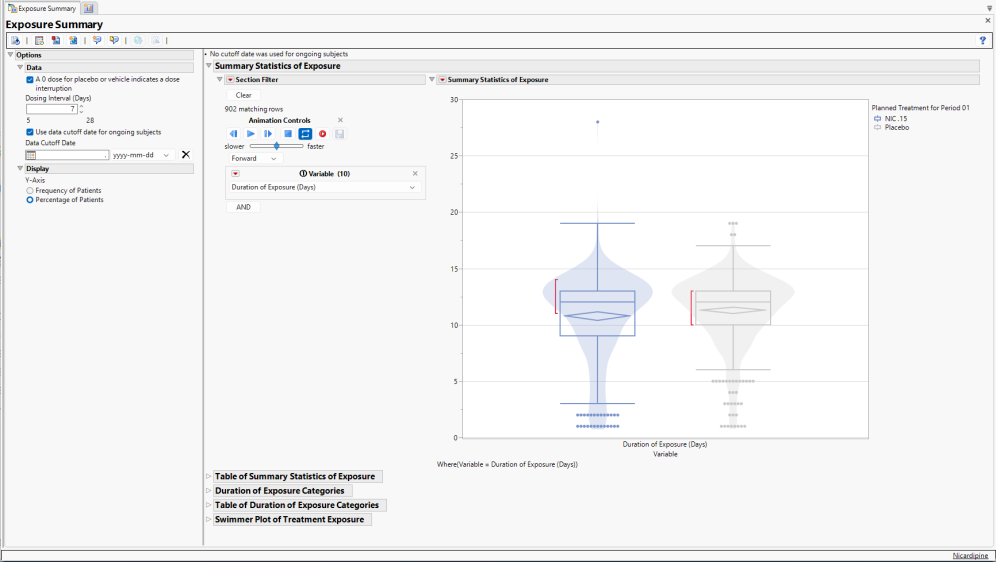
Running Exposure Summary for Nicardipine using default settings generates the Report shown below.
The Report contains the following elements:
Summary Statistics of Exposure
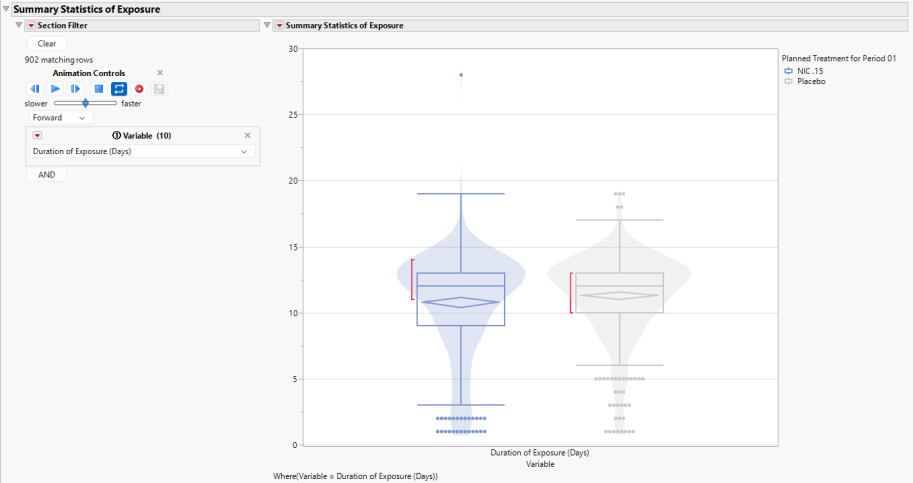
This figure presents bar charts with overlaid violin plots by Treatment Group for each Treatment available in the Exposure (EX) domain to communicate the distributions of the following Variables:
1. Duration of Exposure (Days)
2. Total Dose of Treatment
3. Average Daily Dose Over the Duration of Exposure
4. Frequency of Days Receiving Treatment
5. Percent of Duration Days Receiving Treatment
6. Average Daily Dose Over the Days Receiving Treatment
7. Frequency of Dosing Gaps
If Dosing Gaps are observed, the following additional variables are summarized:
8. Min(Duration of Dosing Gap (Days))
9. Median(Duration of Dosing Gap (Days))
10. Max(Duration of Dosing Gap (Days))
Use the section filter, at left, to specify the variable displayed in the plot. Alternatively use the animation control to cycle between all of the variables.
Any markers present in the graph highlights outliers for a particular Variable. The confidence diamond displays the width of the 95% confidence interval around the Variable mean, with the widest point of the diamond illustrating the mean value. The red bar communicates the “shortest half”, which is the densest 50% of the observations.
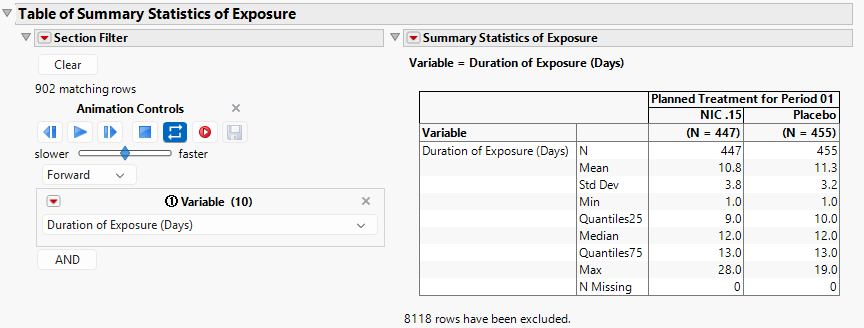
Summary statistics are provided in the Table of Summary Statistics of Exposure (below).
Note that the results in the plot and table shown above would be presented by Treatment and Period if subjects happen to receive more than one Treatment and/or the clinical trial had multiple Periods. For example, if some Nicardipine subjects inadvertently received Placebo, or some Placebo subjects inadvertently received Nicardipine, Treatment would be summarized within each level of the Treatment Group. It is important to remember that Treatment Group and Treatments received are different concepts.
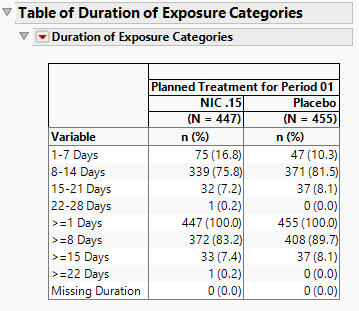
Duration of Exposure Categories
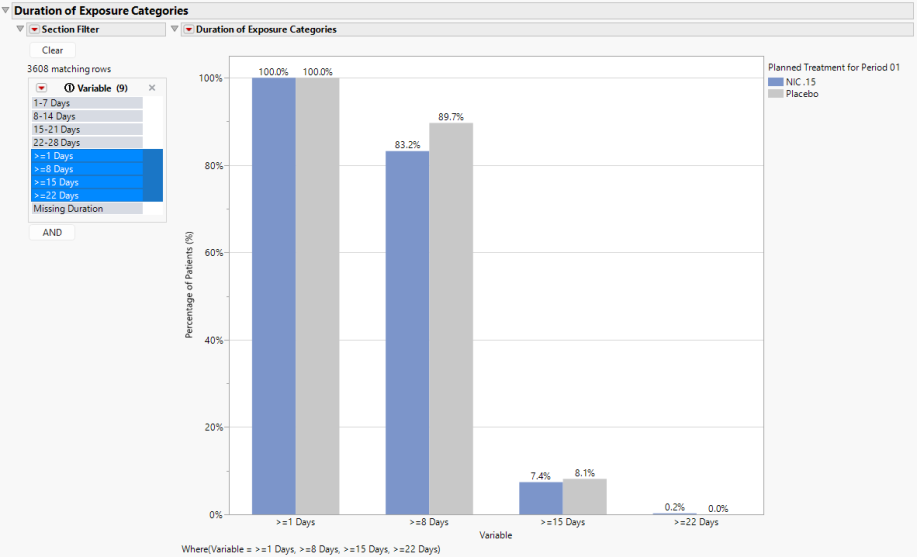
Categorical Variables of Duration of Exposure (Days) are presented in the next two sections of output and are determined by the Dosing Interval (Days) option. Graphical results are shown above.
For Nicardipine, in addition to the category of Missing Duration, 4 individual and 4 cumulative categories are created based on 7-day increments.
| • | Individual |
a. 1-7 Days
b. 8-14 Days
c. 15-21 Days
d. 22-28 Days
| • | Cumulative |
a. >=1 Days
b. >=8 Days
c. >=15 Days
d. >=22 Days
| • | Missing Duration |
While it is possible to present all binary Variables at once due to the similarity of scale, the cumulative indicators are presented by default to minimize crowding. The y-axis Percentages of Subjects (%) can be changed to Frequency of Subjects using the Display Option.
Summary statistics are provided in the Table of Duration of Exposure Categories.
Note that the results in this section would be presented by Treatment and Period if subjects happen to receive more than one Treatment and/or the clinical trial had multiple Periods.
Swimmer Plot of Treatment Exposure
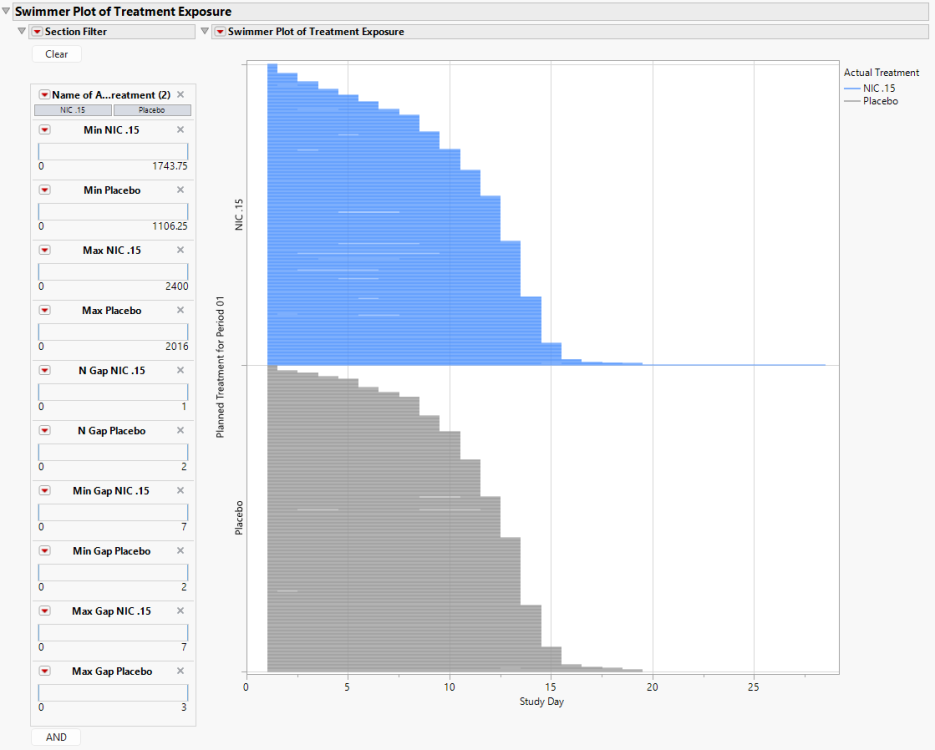
The Swimmer Plot displays the subject journey from when they first begin any Treatment until they end their last Treatment. Subjects are sorted by the maximum end date for any Treatment and presented within Treatment Group.
Here, we can observe a few details:
| • | Both the Nicardipine and Placebo groups had subjects discontinue Treatments early, and there was a fairly consistent pattern of Treatment discontinuation over time between the two Treatment Groups. |
| • | Despite being a two week study, there are a few subjects whose treatment exceeded Study Day 14, with one individual on NIC .15 being treated until Study Day 28. |
| • | There are some Dosing Gaps present, though with approximately 450 subjects (rows) presented for each level of the Treatment Group, this is difficult to discern. This is where the Section Filter becomes extremely useful. |
The section filter includes the following variables:
| • | Treatment: This will include values for the Name of the Actual Treatment (EX.EXTRT) that are observed in the Exposure (EX) domain. |
| • | Treatment Minimums and Maximums: The minimum and maximum daily doses for each Treatment are available to filter subjects. For example, there are Min NIC. 15 and Max NIC. 15. |
| • | Frequency of Treatment Gaps: The frequency of Dosing Gaps of at least one day for each Treatment are available to filter subjects. For example, there are N Gap NIC. 15 and N Gap Placebo. For NIC. 15, there are subjects with 0 or 1 Dosing Gaps. For Placebo, there are subjects with 0, 1, or 2 Dosing Gaps. |
| • | Dosing Gap Minimums and Maximums: The minimum and maximum Dosing Gap duration (in days) for each Treatment are available to filter subjects. For example, there are Min Gap Placebo and Max Gap Placebo. |
The Section Filter variables makes it straightforward to find individuals with unusual daily doses, or frequent and lengthy (or brief) Dosing Gaps.
Lines in the swimmer plot extend 0.5 before the first dose and 0.5 days after the final dose of a drug. This feature was included so that subjects transitioned from one drug to a new drug during the course of treatment would not show a gap in treatment. For example, if a subject is dosed from Day 1 to 8, and starts a new drug from Day 9 to 15, this would create a break in the line from Day 8-9 which makes it looks like there was an interruption. To avoid this, the line is drawn from Day 1 to 8.5 and 8.5 to 15 so that the line looks continuous. While the 0.5 day is artificial, everything within this report works at the day level, and users hovering over the point will see the correct stop and start dates/days.
Annotated Swimmer Plot
When filtering, either through the Section Filter or Review Subject Filter, once 50 or fewer subjects are reached, an annotated view of the Swimmer Plot is provided which focuses on subjects and presents markers of changing dose. Hovering over the markers will provide the dose as well as the Start and End Dates and Study Days of the Treatment at this particular dose. Each marker represents a change in dose, so subjects with numerous markers reflect numerous dose changes.
Note that if two or more treatments are taken on the same day of a subject, the combination of those Treatments is considered a separate Treatment. Admittedly, the Nicardipine study is a challenging example to summarize exposure in a Swimmer Plot. Because the drug is given intravenously and the amount of drug received is proportional to the amount of time the subject is treated, frequent dosing changes occur over the study. There are just too many changes to represent particular doses with unique colors in the Swimmer Plot to effectively communicate what subjects are taking without relying on markers. However, for studies where the number of treatments is low with a small number of unique daily doses, Exposure Summary will utilize more effective colors to present the Swimmer Plot. Here are the general guidelines:
| • | With 4 or more Treatments or combination of Treatments observed on the same day, the Swimmer Plot will summarize Treatments using colors from the JMP standard color table. |
| • | With 3 or fewer Treatments or combination of Treatments observed on the same day, three-level blue, red, and gray scales will be used to summarize Treatments with 3 or fewer doses. Should a Treatment have more than 3 doses, the Treatment is described using a single color from one of the 3 color scales. At most, 9 colors (3 shades of 3 colors) will be presented in a Swimmer Plot. Colors are selected to maximize the contrast between doses. |
Assumptions
| • | When available, Exposure Summary assumes that each level of Treatment (EX.EXTRT) is measured using a single value of Dose Units (EX.EXDOSU). |
| • | If End Date/Time of Treatment (EX.EXENDTC) is not available, it is assumed to be equal to Start Date/Time of Treatment (EX.EXSTDTC). If Start and End Date/Time of Treatment are both available, but End Date/Time is missing, it is assumed to be equal to Start Date/Time of Treatment. |
| • | If Dosing Frequency per Interval (EX.EXDOSFRQ) and/or Dose Units (EX.EXDOSU) are available, the following modifications are made to the Actual Dose computed for each dosing record: |
| • | If the end of EX.EXDOSU is reported as “/H” (per hour) or “/MIN” (per minute), the number of hours or minutes between the dosing Start Date/Time and End Date/Time are computed to derive an Actual Dose from dose (EX.EXDOSE) by multiplying by the amount of time. Dosing units will be updated to remove “/H” or “/MIN”. |
| • | If EX.EXDOSFRQ equals “QD” or “Once”, the Actual Dose is equivalent to dose (EX.EXDOSE). |
| • | If EX.EXDOSFRQ equals “BID” or “Twice”, the Actual Dose is equivalent to 2 × dose (EX.EXDOSE). |
| • | If EX.EXDOSFRQ equals “TID” or “Thrice”, the Actual Dose is equivalent to 3 × dose (EX.EXDOSE). |
| • | If EX.EXDOSFRQ equals “QID”, the Actual Dose is equivalent to 4 × dose (EX.EXDOSE). |
| • | If EX.EXDOSFRQ equals “X Times Per Day”, where X is 5, 6, 7, 8, or 9, the Actual Dose is equivalent to X × dose (EX.EXDOSE). |
| • | Otherwise, Actual Dose is assumed to be equivalent to dose (EX.EXDOSE). |
| • | If multiple Periods are detected through the presence of multiple Date or Datetime of First Exposure in Period xx variables (ADSL.TRxxSDT or ADSL.TRxxSDTM), Period (APERIOD) will be defined for Exposure (EX) using conventions detailed here. |
| • | If APERIOD exists in the data, then the values of APERIOD are used. If it doesn't exist, then the treatment start date ADSL variables (TRTxxSDTM/TRTxxSTDT) are used to assign a numeric value to JMPC_APERIOD. The pre-treatment interventions are assigned a value of 0. |
| • | In this case, summary statistics for tables and figures will be computed and displayed by Period, as well as for values taken across all Periods together. The summary statistics across all Periods (Total Across All Periods) sums the Duration of Exposure, Total Dose of Treatment, Frequency of Days Receiving Treatment, Frequency of Dosing Gaps, and recomputes the Dosing Gap lengths, average daily doses, and Percent of Duration Days Receiving Treatment. This point is important, as Duration of Exposure is not computed as first date a Treatment is taken in the earliest Period to the latest date a treatment is taken in the latest period, and Dosing Gaps are computed within Period and not across Periods. |
The exception to the above description for Periods is in the presentation of the swimmer plot which summarizes the treatments and doses a subject receives by Study Day. Here, Period is essentially ignored in the presentation of the Swimmer Plot, and the Frequency of Treatment Gaps and Dosing Gap Minimums and Maximums in the Section Filter represent Dosing Gaps derived ignoring Period.
Options
Data
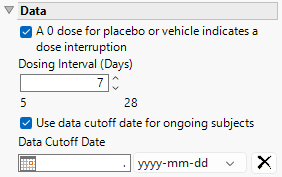
A 0 dose for placebo or vehicle indicates a dose interruption
Check this box when Placebo or Vehicle Treatments contain a 0 dose (EX.EXDOSE). Checking this box is equivalent to no Placebo or Vehicle being taken during this time (a Treatment Interruption). When this box is unchecked, doses of zero are interpreted as a period when placebo or treatment were given (i.e. no dose interruption).
Dosing Interval (Days)
This option derives binary indicator variables to summarize the Duration of Exposure categorically. Defaults (shown below) are assumed based on the maximum Duration of Exposure across all Treatments. Otherwise, approximately 4 equal-sized intervals are produced.
| Maximum Duration of Exposure | Default Interval |
|---|---|
| > 540 days (~18 months) | 90 days |
| >90 days (~3 months) | 30 days |
| > 14 days | 7 days |
Use data cutoff date for ongoing subjects
For subjects who are ongoing in the study, it is useful for indicating the date on which the data for this update report was pulled, particularly when considering exposure data. The Use data cutoff date for ongoing subjects and Data Cutoff Date widgets enable you to specify and use a data cutoff date for reporting on ongoing subjects.
Check this box to use the date on which the study data was pulled for this report in place of exposure end date for ongoing subjects.
Data Cutoff Date
Use this widget to specify the date on which the study data was pulled for this report.
Display
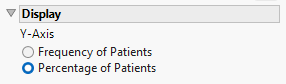
Y-Axis
Use this option to specify whether to plot the results in terms of frequency or percentage of subjects.
General and Drill Down Buttons
Action buttons provide you with an easy way to drill down into your data. The following action buttons are generated by this report:
| • | Click  to rerun the report using default settings. to rerun the report using default settings. |
| • | Click  to view the associated data tables. Refer to Show Tables for more information. to view the associated data tables. Refer to Show Tables for more information. |
| • | Click  to generate a standardized pdf- or rtf-formatted report containing the plots and charts of selected sections. to generate a standardized pdf- or rtf-formatted report containing the plots and charts of selected sections. |
| • | Click  to generate a JMP Live report. Refer to Create Live Report for more information. to generate a JMP Live report. Refer to Create Live Report for more information. |
| • | Click  to take notes, and store them in a central location. Refer to Add Notes for more information. to take notes, and store them in a central location. Refer to Add Notes for more information. |
| • | Click  to read user-generated notes. Refer to View Notes for more information. to read user-generated notes. Refer to View Notes for more information. |
| • | Select one or more subjects, then click  to apply the Review Subject Filter and filter all reports in the review builder on the selected subjects. to apply the Review Subject Filter and filter all reports in the review builder on the selected subjects. |
| • | Select a group of subjects and click  to specify Derived Population Flags that enable you to distinguish the selected group of subjects from the general population based on their meeting specific criteria. to specify Derived Population Flags that enable you to distinguish the selected group of subjects from the general population based on their meeting specific criteria. |
Default Settings
Refer to Set Study Preferences for default Subject Level settings.