Example of Measurement Error Models
Measurement error models in the Structural Equation Models platform can be appliedused to analyze survey responses, especially if you suspect that there might be inaccuracies or biases in the responses. This example demonstrates how to analyze responses of 200 individuals to a survey that was developed by an employee in the human resources department to measure key workplace constructs related to their job satisfaction. The survey includes 11 questions that can be divided into three categories of leadership, conflict, and satisfaction. Responses that an individual gives to questions in each category are averaged and placed as the score for that specific category in a separate column,: Leadership_Avg, Conflict_Avg, and Satisfaction_Avg.
Suppose you are interested in understanding the relationship between specific job satisfaction aspects (Leadership_Avg, Conflict_Avg) and overall job satisfaction (Satisfaction_Avg). If you believe that responses to the survey questions are measured with errors, a measurement error model would adjust for these inaccuracies, leading to more reliable estimates. Such measurement errors could exist for various reasons. For example, respondents might overestimate or underestimate their job satisfaction. Additionally, different respondents might interpreted the survey questions differently, which could leading to systematic measurement errors in their responses. The survey questions themselves might also not perfectly capture the intended aspects of job satisfaction.
WeYou also know from prior studies that there is possibley measurement error in both the predictors (Leadership_Avg and Conflict_Avg) and the outcome (Satisfaction_Avg). Let’s aAssume that the estimates of reliable variance (Reliability) are 0.87 for Leadership_Avg, 0.76 for Conflict_Avg, and 0.82 for Satisfaction_Avg. Remember that you could use Unreliability to specify the estimates of reliable variance instead of Reliability. Alternatively, specific values could be used as the estimates of measurement error variance instead of Reliability/Unreliability proportions.
1. Select Help > Sample Data Folder and open Job Satisfaction.jmp.
2. Select Analyze > Multivariate Methods > Structural Equation Models.
3. Select Leadership_Avg, Conflict_Avg, and Satisfaction_Avg and click Model Variables.
4. Click OK.
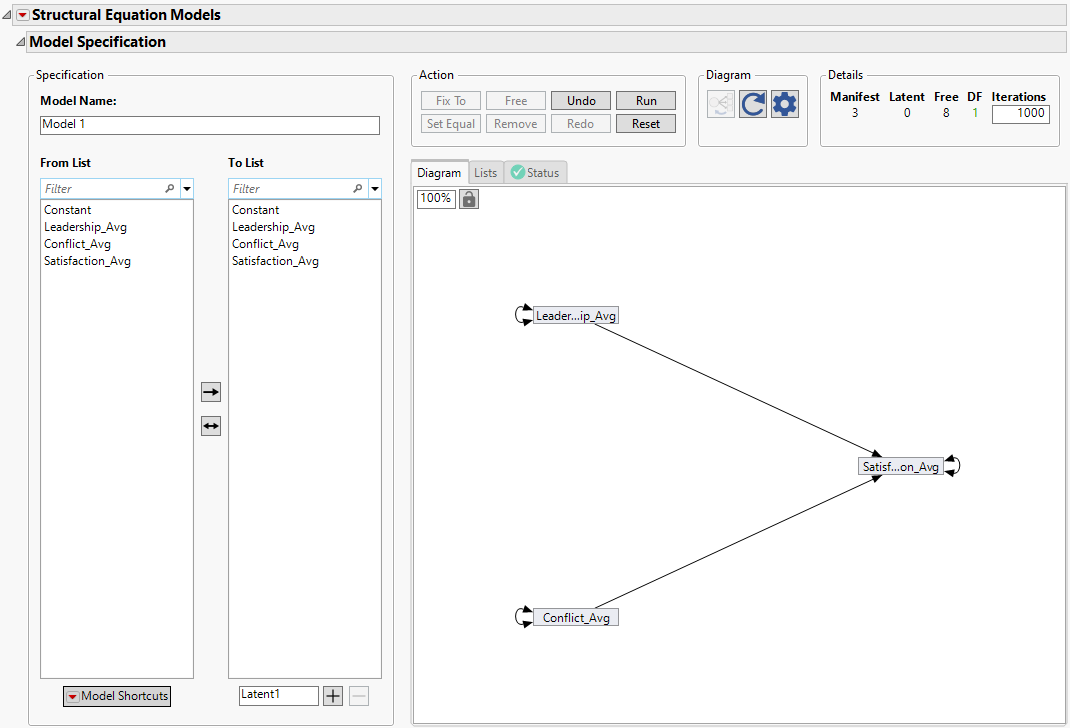
5. In the Model Specification report, sSelect Leadership_Avg, and Conflict_Avg in the From List, andselect Satisfaction_Avg in the To List, and click the unidirectional arrow  button.
Figure 8.17 Measurement Error Model Specification
6. Click the Model Shortcuts red triangle and select Specification Assist > Fix Measurement Error.
7. In the Account for Measurement Error in Observed Variables window, select Leadership_Avg, Conflict_Avg , and Satisfaction_Avg for which there is an estimate of reliable variance. Then s
8. Select Reliability (0-1) as the estimate type and enter 0.87, 0.76, and 0.82 as the estimates for Leadership_Avg, Conflict_Avg , and Satisfaction_Avg, respectively. You can either keep the latent variable names as they name them differently in the box where the estimates are entered.
Figure 8.18 Measurement Error Model Reliable Variance Estimates

9. Click OK.
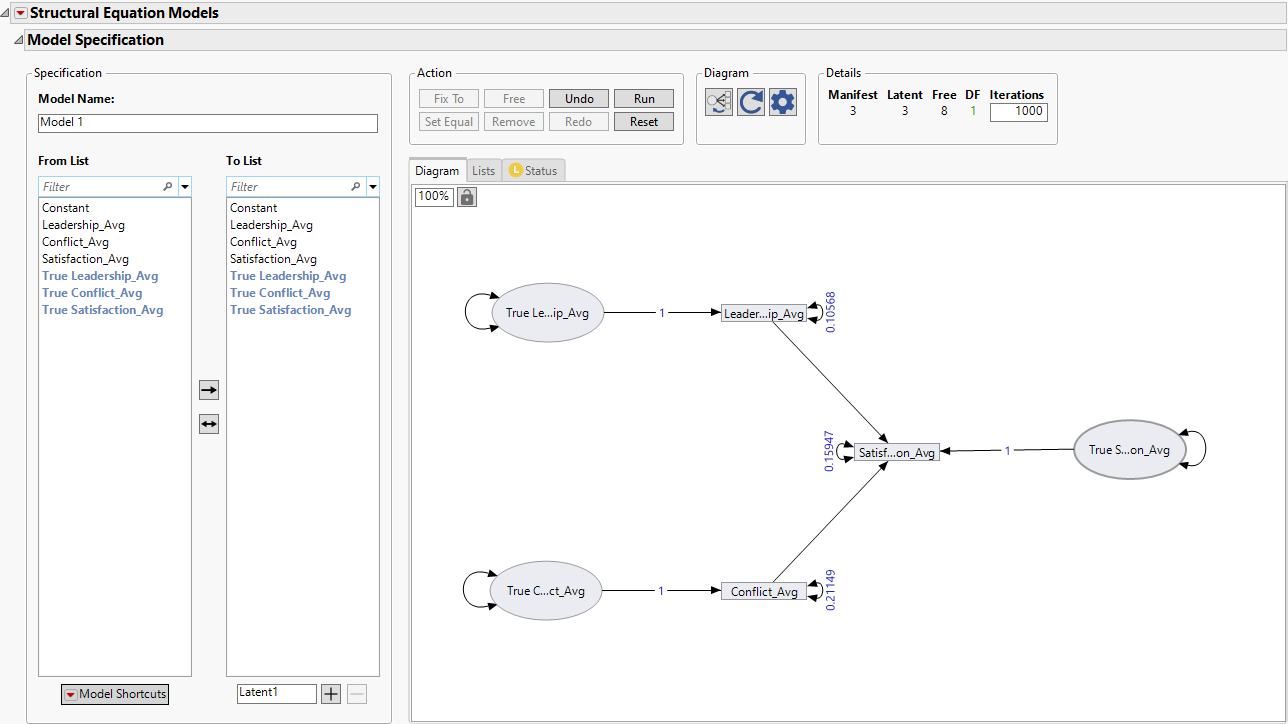
Figure 8.19 Updated Measurement Error Model Specification
10. Click Run in the Action panel to create the report for the currently specified model.
Figure 8.20 Measurement Error Model Report
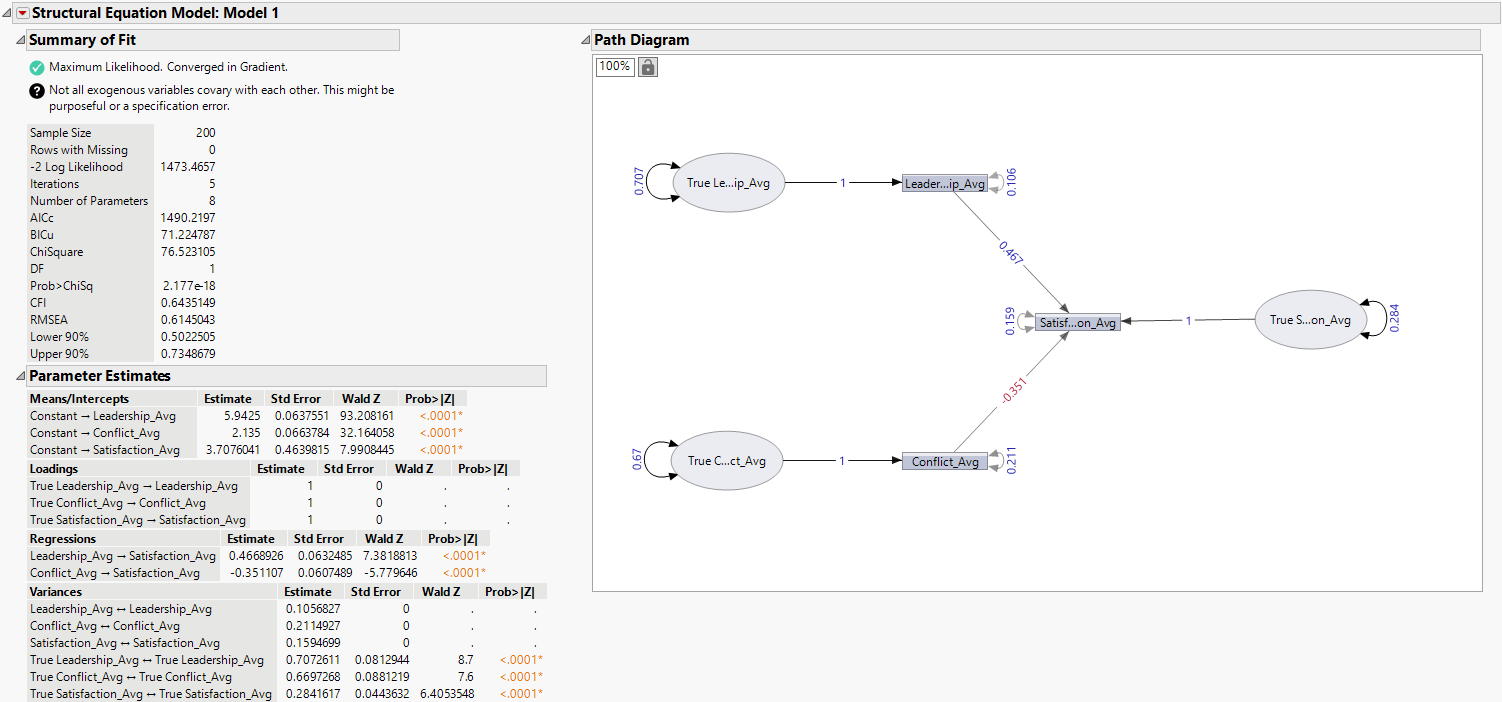
The Structural Equation Model report that appears includes Summary of Fit and Parameter Estimates tables, and the Path Diagram. The model emphasizes direct effects between dependent and independent variables. The path diagram shown in Figure 8.19Figure 8.19 demonstrates the numerical equivalents of the measurement error variances that you already specified as reliability estimates. These numerical equivalents of the measurement error variances are 0.106, 0.211, and 0.159 for Leadership_Avg, Conflict_Avg, and Satisfaction_Avg, respectively.
Further, according to From the Parameter Estimates table in shown in Figure 8.20Figure 8.20, weyou can conclude that both predictors are significant (p-value < 0.0001). The parameter estimates for Leadership_Avg and Conflict_Avgare are 0.46768926 and -0.351107, respectively. Also, the standard errors are 0.0632485 and 0.0607489 for Leadership_Avg and Conflict_Avg, respectively.
Note that the parameter estimates for Leadership_Avg and Conflict_Avg are the same compared to when multiple linear regression is performed and the measurement errors are ignored in the model.
Figure 8.21 Multiple Linear Regression Parameter Estimates
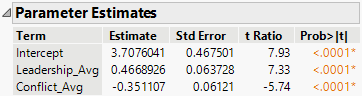
However, the main difference between the two models, with and without accounting for the measurement errors, occurs regardingis the standard errors of the predictors. As Figure 8.21Figure 8.21 indicates, the standard errors in the multiple linear regression model for Leadership_Avg and Conflict_Avg are 0.063728 and 0.06121, respectively. Note that these estimates are higher than when measurement errors are considered in the model (0.0632485 and 0.0607489).