Summary Statistics
This report identifies unusual summary statistics across the entire study or by study visit (if requested). This analysis would typically be used on Findings tests representing continuous variables.
Note: JMP Clinical uses a special protocol for data including non-unique Findings test names. Refer to How does JMP Clinical handle non-unique Findings test names? for more information.
Report Results Description
Running this report with the Nicardipine sample setting generates the report shown below.
The Report contains the following elements:
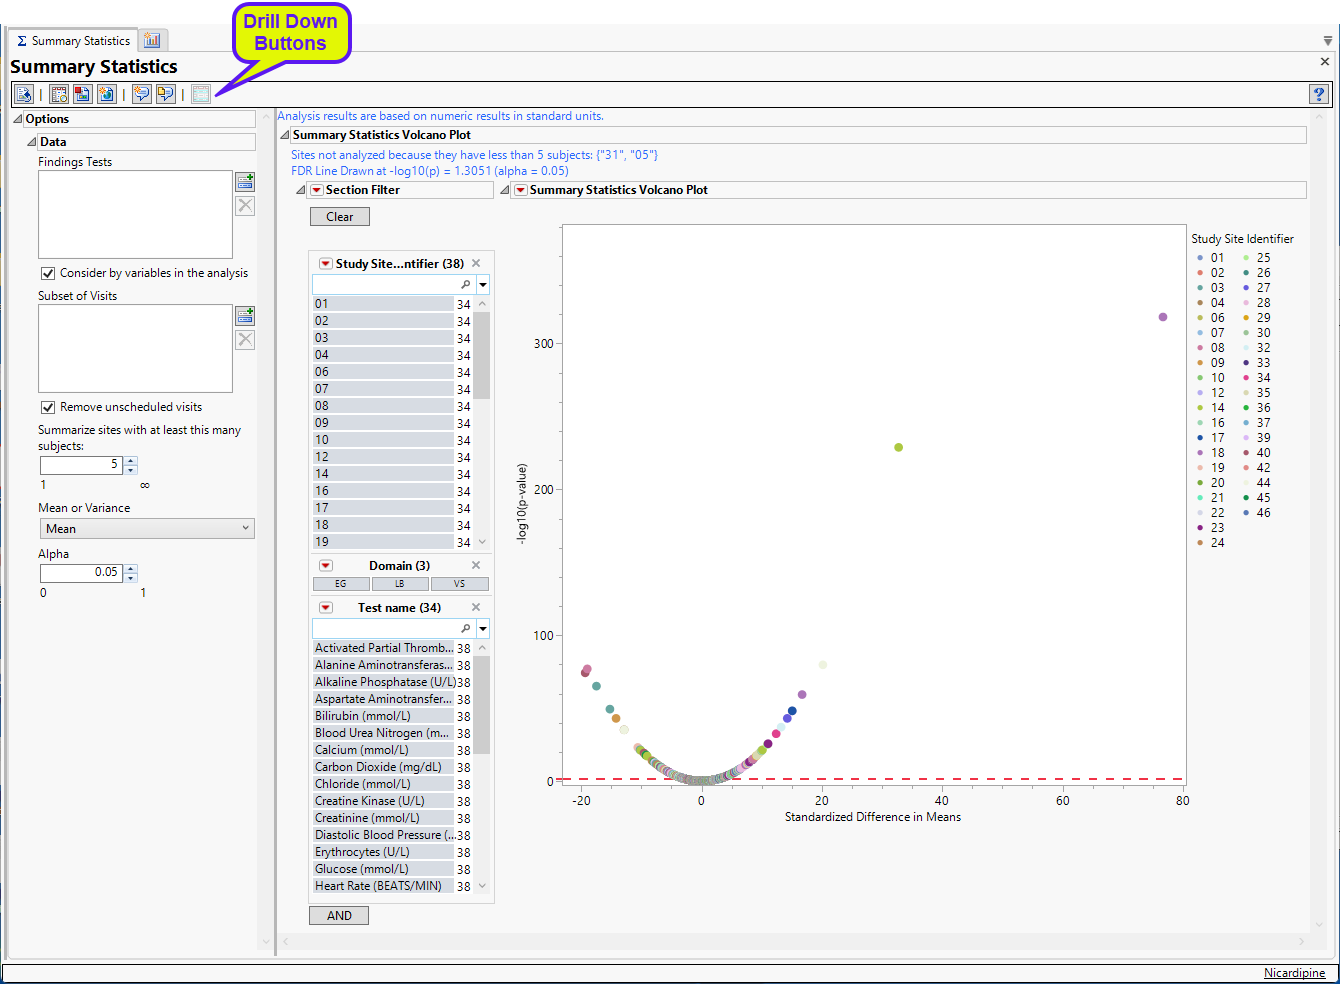
Summary Statistics Volcano Plot
Shows a volcano plot used to determine the deviation of a mean or variance for Findings tests at a site versus other sites. Each point represents a single Findings test for a specific site. Here, the X axis represents the standardized difference in means between the site and the reference set (all other sites). For comparisons of variances, the X axis represents the log2(Ratio of Variances) between the site and the reference set.
This section can differ depending on the type of analysis that you perform.
Analysis of Mean or Variance
If you specify either Mean or Variance, you generate a volcano plot similar to that shown below:
This section contains the following elements:
| • | One Subject Filter. |
Enables you to subset subjects based on country of origin, study site and/or Test. Refer to Data Filter for more information.
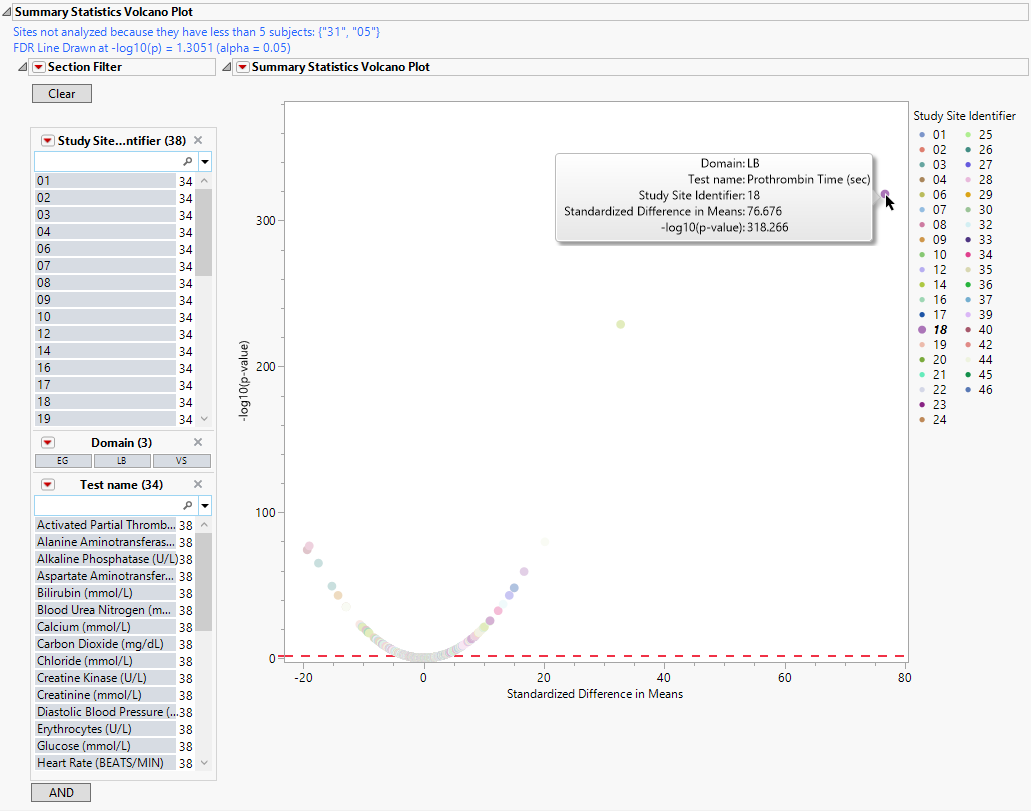
| • | One Volcano Plot. |
The volcano plot is used to determine the deviation of a mean or variance for Findings tests at a site versus other sites. Each point represents a single Findings test for a specific site. Here, the X axis represents the standardized difference in means between each between the site and the reference set (all other sites). For comparisons of variances, the X axis represents the log2(Ratio of Variances) between the site and the reference set. -log10 (p-values) are plotted on the Y axis. While most of the findings are close to the means across all of the sites. some of the points lie farther to the right or left of 0, indicating larger differences between the site and the reference set.
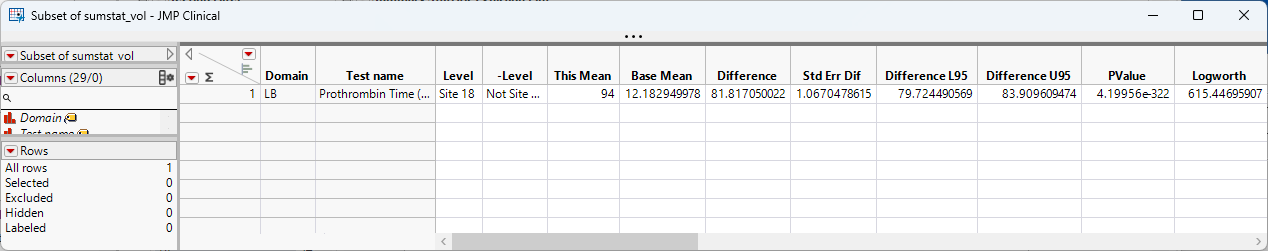
You can mouse over points of interest to see their labels or select points by dragging a mouse rectangle over them (as shown above). Selected rows are highlighted in other plots and you can also then click on various Drill Down Buttons for further analyses on those specific sites. In this example, we click  to view summary statistics for the selected point skewed to the right. The corresponding row is viewed in the following subset.
The mean systolic blood pressure findings at this site average 13 points higher than the other sites. This finding might warrant further investigation.
Options
Data
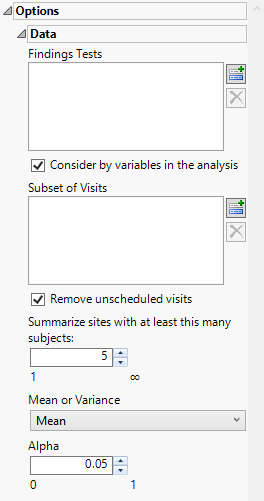
Findings Tests
Use this widget to select Findings Tests for the analysis. The report will autorun and analysis is restricted to the selected tests only.
Consider BY variables in the analysis
You can opt to Consider BY variables in the analysis. This option, which assumes that BY variables (left vs. right arm for collecting blood pressure data, for example) are included in the experimental design, is selected by default. You can uncheck this option to ignore BY variables.
Subset of Visits
Use the Subset of Visits option to select the visits to be included in the analysis.
Remove unscheduled visits
You might or might not want to include unscheduled visits when you are analyzing findings by visit. Check the Remove unscheduled visits to exclude unscheduled visits.
Summarize sites with at least this many subjects:
The Summarize sites with at least this many subjects: widget enables you to set a minimal threshold for the sites to be analyzed. Only those sites which exceed the specified number of subjects are included. This feature is useful because it enables you to exclude smaller sites, where small differences due to random events are more likely to appear more significant than they truly are. In larger sites, observed differences from expected attendance due to random events are more likely to be significant because any deviations due to random events are less likely to be observed.
Note: This option applies only to the volcano plot. Small sites are still included in the "Not Site X" bin.
Mean or Variance
By default, By default, this report summarizes the means across the study. Optionally, you can choose to summarize the variances. Use the Mean or Variance drop down widget to select the statistic to use.
Alpha
The Alpha option is used to specify the significance level by which to judge the validity of the statistics generated by this report. By definition, alpha represents the probability that you will reject the null hypothesis when the null is, in fact, true. Alpha can be set to any number between 0 and 1, but is most typically set at 0.01, 0.05, or 0.10. The higher the alpha, the lower your confidence that the results you observe are correct.
Action Buttons
Action buttons provide you with an easy way to drill down into your data. The following action buttons are generated by this report:
| • | Show Summary Statistics: Shows the rows of the data table for the selected points from the volcano plot (see above). |
General and Drill Down Buttons
Action buttons provide you with an easy way to drill down into your data. The following action buttons are generated by this report:
| • | Click  to reset all report options to default settings. to reset all report options to default settings. |
| • | Click  to view the associated data tables. Refer to Show Tables for more information. to view the associated data tables. Refer to Show Tables for more information. |
| • | Click  to generate a standardized pdf- or rtf-formatted report containing the plots and charts of selected sections. to generate a standardized pdf- or rtf-formatted report containing the plots and charts of selected sections. |
| • | Click  to generate a JMP Live report. Refer to Create Live Report for more information. to generate a JMP Live report. Refer to Create Live Report for more information. |
| • | Click  to take notes, and store them in a central location. Refer to Add Notes for more information. to take notes, and store them in a central location. Refer to Add Notes for more information. |
| • | Click  to read user-generated notes. Refer to View Notes for more information. to read user-generated notes. Refer to View Notes for more information. |
Methodology
You can opt to plot either the mean comparisons or the variance comparisons on the y-axis of the volcano plot. In both cases, standardized mean differences are plotted on the x-axis. These statistics are computed as follows:
Mean Comparison
Each site’s mean for a given Findings test is compared to the aggregate mean from all other sites using an unpaired t-test with unequal variances (Welch’s t-test)(Welch, 1947).
Test Statistic
- An unpaired t-test assuming unequal variances between the groups is used.
where:
 and
and  are the sample means of groups 1 and 2, respectively,
 and
and  are the sample variances of groups 1 and 2, respectively, and
 and
and  are the sample sizes of groups 1 and 2, respectively.
This is the difference in means divided by the estimated standard error that allows unequal variances.
Degrees of Freedom (Welch-Satterthwaite approximation)
This produces a non-integer degrees of freedom, which is then used to reference the t-distribution.
p-Value Calculation
| • | Two-sided test |
where TV follows the t-distribution with v degrees ofS freedom.
| • | One-sided test |
Use either  or
or  .
.
FDR p-values are calculated and the reference line is determined as described in How does JMP Clinical calculate the False Discovery Rate (FDR)?.
Variance Comparison
Variances are compared using a test for unequal variances (e.g., F-test), between each site (group 1) and the pooled reference set (all other sites, group 2).

where:
and are the sample variances of groups 1 and 2, respectively, and
The ratio is always positive. If the two groups come from populations with equal variance  ,then F follows an F distribution:
where n1-1 and n2-1 are the degrees of freedom of the numerator and denominator, respectively.
p-Value Calculation
| • | Two-sided test |
This tests whether the variance ratio is significantly either higher or lower than 1.
Because variance ratios can span orders of magnitude, JMP Clinical plots the log2 of the variance ratio:
In this scenario, if x = 0, the variance at the site is equal to the variance of the other sites; if x = +1, the variance at the site is double the variance of the other sites; and, if x = -1, the variance at the site is half the variance of the other sites. This makes interpretation symmetric.
FDR p-values are calculated and the reference line is determined as described in How does JMP Clinical calculate the False Discovery Rate (FDR)?.
Standardized Mean Difference (SMD)
where:
and are the sample means of groups 1 and 2, respectively.
Sometimes the SMD is essentially the t-statistic normalized by sample size. For paired data (screening vs. baseline from the same site, for example) it can be represented as:
where  is the standard error of the paired difference.
Reference
Welch, B. L. (1947). The generalization of "Student's" problem when several different population variances are involved. Biometrika 34 : 28–35.