Study Flow Diagram
This report generates a flow diagram to summarize the overall clinical trial data flow.
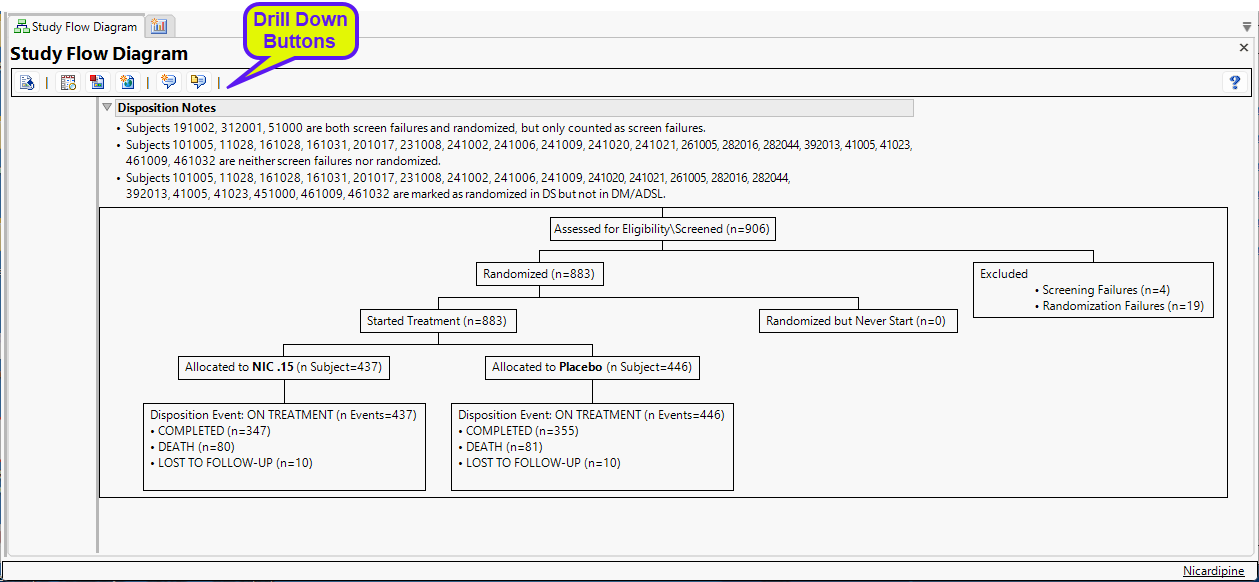
The diagram, generated from the Nicardipine study, starts with 906 subjects initially assessed for eligibility. Four subjects failed preliminary screening and were dropped from the study. Of the 902 remaining, 883 were randomized and divided into two groups: 437 subjects in the treatment group (NIC. 15) and 446 subjects in the placebo group. Treatment and placebo groups have similar disposition events: Completed (347 and 335); death (80 and 81) and lost to follow-up (10 and 10).
Data from both the DM and DS domains were used to generate this diagram. The default population and treatment variable from "Set Study Preferences" are used in this report.
Disposition Notes
The following notes describing disposition details may be included above the diagram.
| • | Subjects that are both screen failures and randomized are listed in the first note. |
| • | Subjects that are neither screen failures nor randomized are listed in the second note. However, if there is no randomization information in the data, this note states there is no randomization information. |
| • | Subjects that are marked as randomized in DM/ADSL but not in DS are listed in a third note. If randomization information only exists in DM/ADSL and not DS, then this note will state that randomization information is only in DM/ADSL. |
| • | Subjects that are marked as randomized in DS but not in DM/ADSL are listed in a fourth note. If randomization information only exists in DS and not in DM/ADSL, then this note will state that randomization information is only in DS. |
Note: The CDISC variable DSDECOD is primarily used to calculate the number of disposition events per subgroup of interest.
Note: This report can generate subcategory boxes for Disposition Events if DS.EPOCH exists or DS.DSSCAT exists.
Note: This report can also extract information from the EX and ADSL domains.
Note: When a study contains EPOCHs, any disposition boxes (specified by DSSCAT) for each EPOCH are shown on the same level. Disposition subcategories are shown below this level. When no EPOCH exists, but DSSCAT does exist, disposition subcategories are shown as Disposition event boxes. If DSSCAT does not exist, disposition event boxes are shown for each treatment arm disposition events are considered ON-TREATMENT
Action Buttons
General and Drill Down Buttons
Action buttons provide you with an easy way to drill down into your data. The following action buttons are generated by this report:
| • | Click  to reset all report options to default settings. to reset all report options to default settings. |
| • | Click  to view the associated data tables. Refer to Show Tables for more information. to view the associated data tables. Refer to Show Tables for more information. |
| • | Click  to generate a standardized pdf- or rtf-formatted report containing the plots and charts of selected sections. to generate a standardized pdf- or rtf-formatted report containing the plots and charts of selected sections. |
| • | Click  to generate a JMP Live report. Refer to Create Live Report for more information. to generate a JMP Live report. Refer to Create Live Report for more information. |
| • | Click  to take notes, and store them in a central location. Refer to Add Notes for more information. to take notes, and store them in a central location. Refer to Add Notes for more information. |
| • | Click  to read user-generated notes. Refer to View Notes for more information. to read user-generated notes. Refer to View Notes for more information. |
Note: A wide diagram can be truncated in an rtf static report. To view the entire diagram in MS Word, Select View > Web Layout.
Note: You can change the layout of the diagram from the hierarchical view shown above to a nested or fishbone format by right-clicking on the diagram, clicking Change Type in the pop-up menu and making your selection.