Medical Query Risk Report
This process screens medical query terms by performing Cochran-Mantel-Haenszel (CMH) tests on all 2 x 2 tables constructed from event incidence and treatment arm. Output is a two-sided plot with a dot plot showing percent occurrence and forest plot showing risk measurement. Additionally there are 4 tables for narrow queries with dictionary-derived terms, broad queries with dictionary-derived terms, broad and narrow queries, and queries by System Organ Class (SOC).
The Office of New Drugs Custom Medical Query terms (OCMQs) are similar to SMQs and are the default version used in JMP Clinical. They are being promulgated by the FDA to further consolidate and standardize descriptions of medical conditions. Excel files containing OCMQs can be downloaded from https://www.fda.gov/drugs/development-resources/office-new-drugs-custom-medical-queries-ocmqs. Downloaded files should be saved to $DOCUMENTS\OCMQ\Version Number, where Version Number is the version of the FDA OCMQ xlsm file. If this folder doesn't exist, you must create it. When there are multiple versions of the OCMQs in the specified folder, you can use the Version of Office of New Drugs Custom Medical Query Files/Version of Standardized Medical Query Files widget on the Set Study Preferences window to specify which version of the OCMQs to use.
Report Results Description
Running Medical Query Risk Report for the Nicardipine study using OCMQ files, the planned treatment ARM, and narrow search queries, generates the Report shown below.
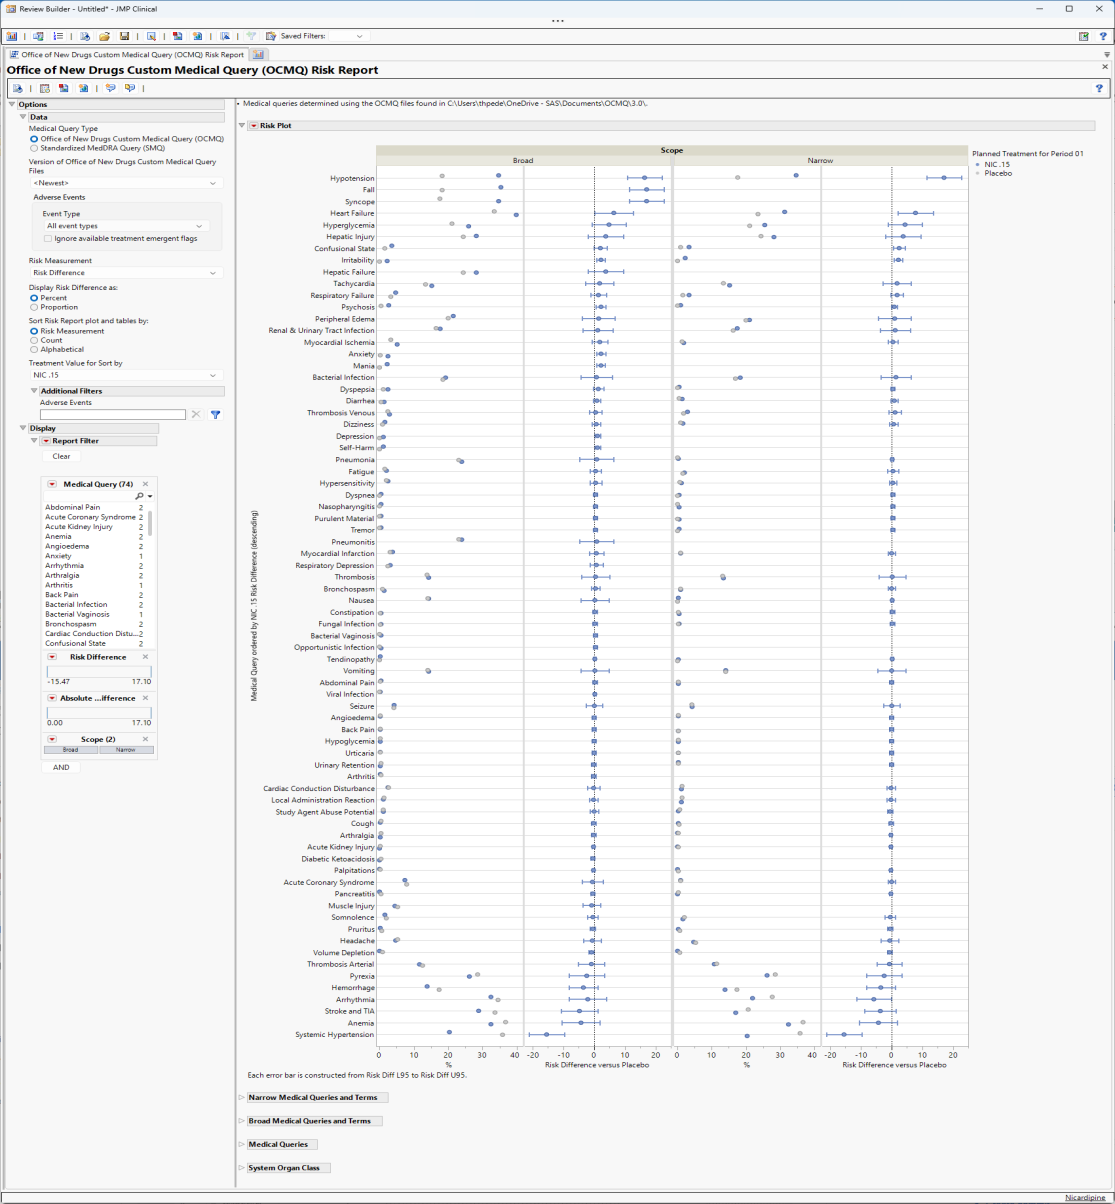
The Report contains the following elements:
Plots
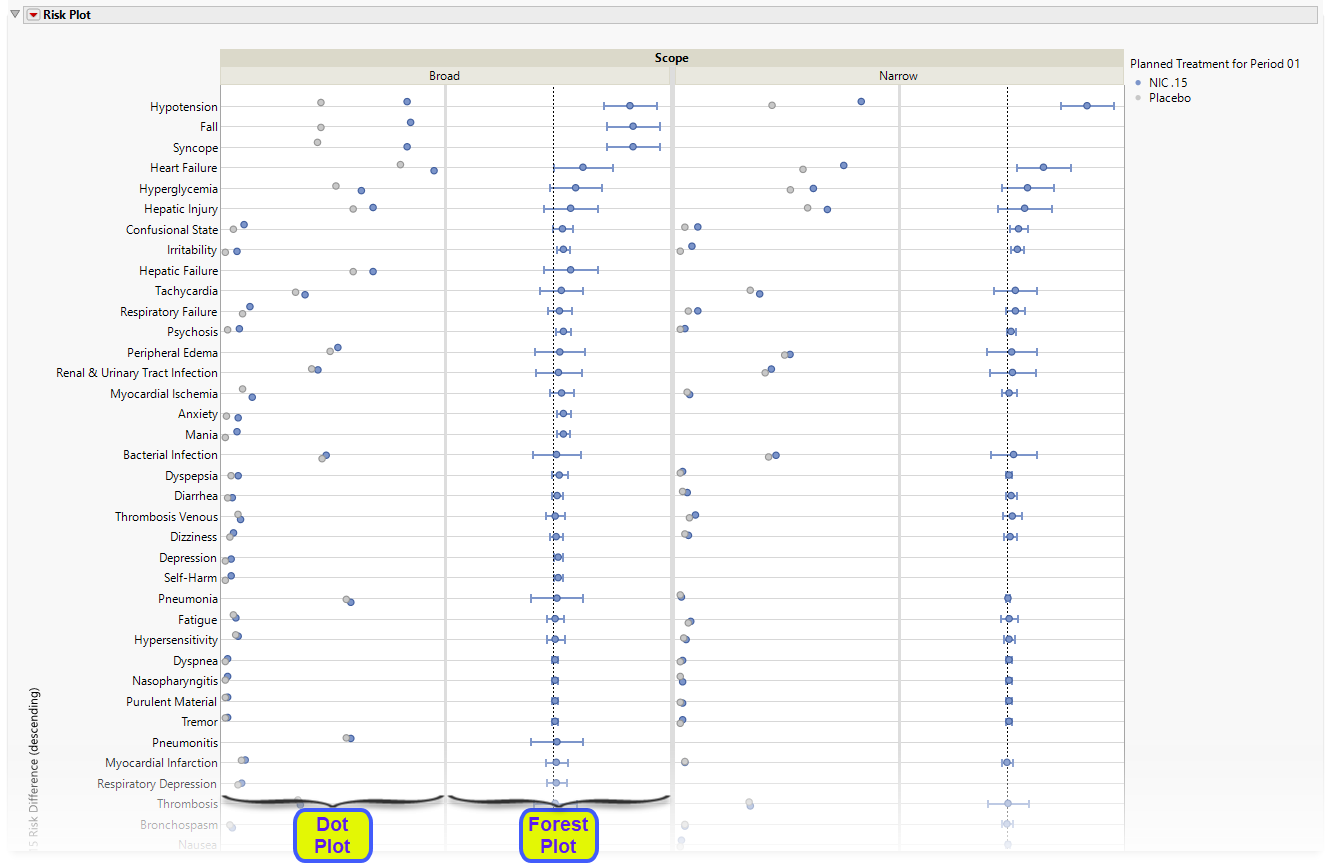
There are four plots shown here: a group of two plots for broad scope queries and a group of two plots for narrow scope queries. Medical queries are shown on the y axis. The dot plot on the left of each group shows the percent occurrence of subjects in each arm exhibiting the queries. The Forest plot on the right of each group shows the risk difference for subjects to exhibit events covered by each query.
Forest Plots display relative strength of treatment effects as horizontal lines representing the 95% confidence interval of the effect observed in that trial. The confidence interval is normally for the relative likelihood of a given nominal-level outcome for the intervention group compared to the control group. In this example, the forest plot shown below, represents the risk difference for developing the specified event relative to exposure to Nicardipine.
Note: When you select either Relative Risk or Odds Ratio as the Risk Measurement, the scale on the x-axis of the Forest plot changes from linear to a log scale.
Tables
Four tables were generated for this example.
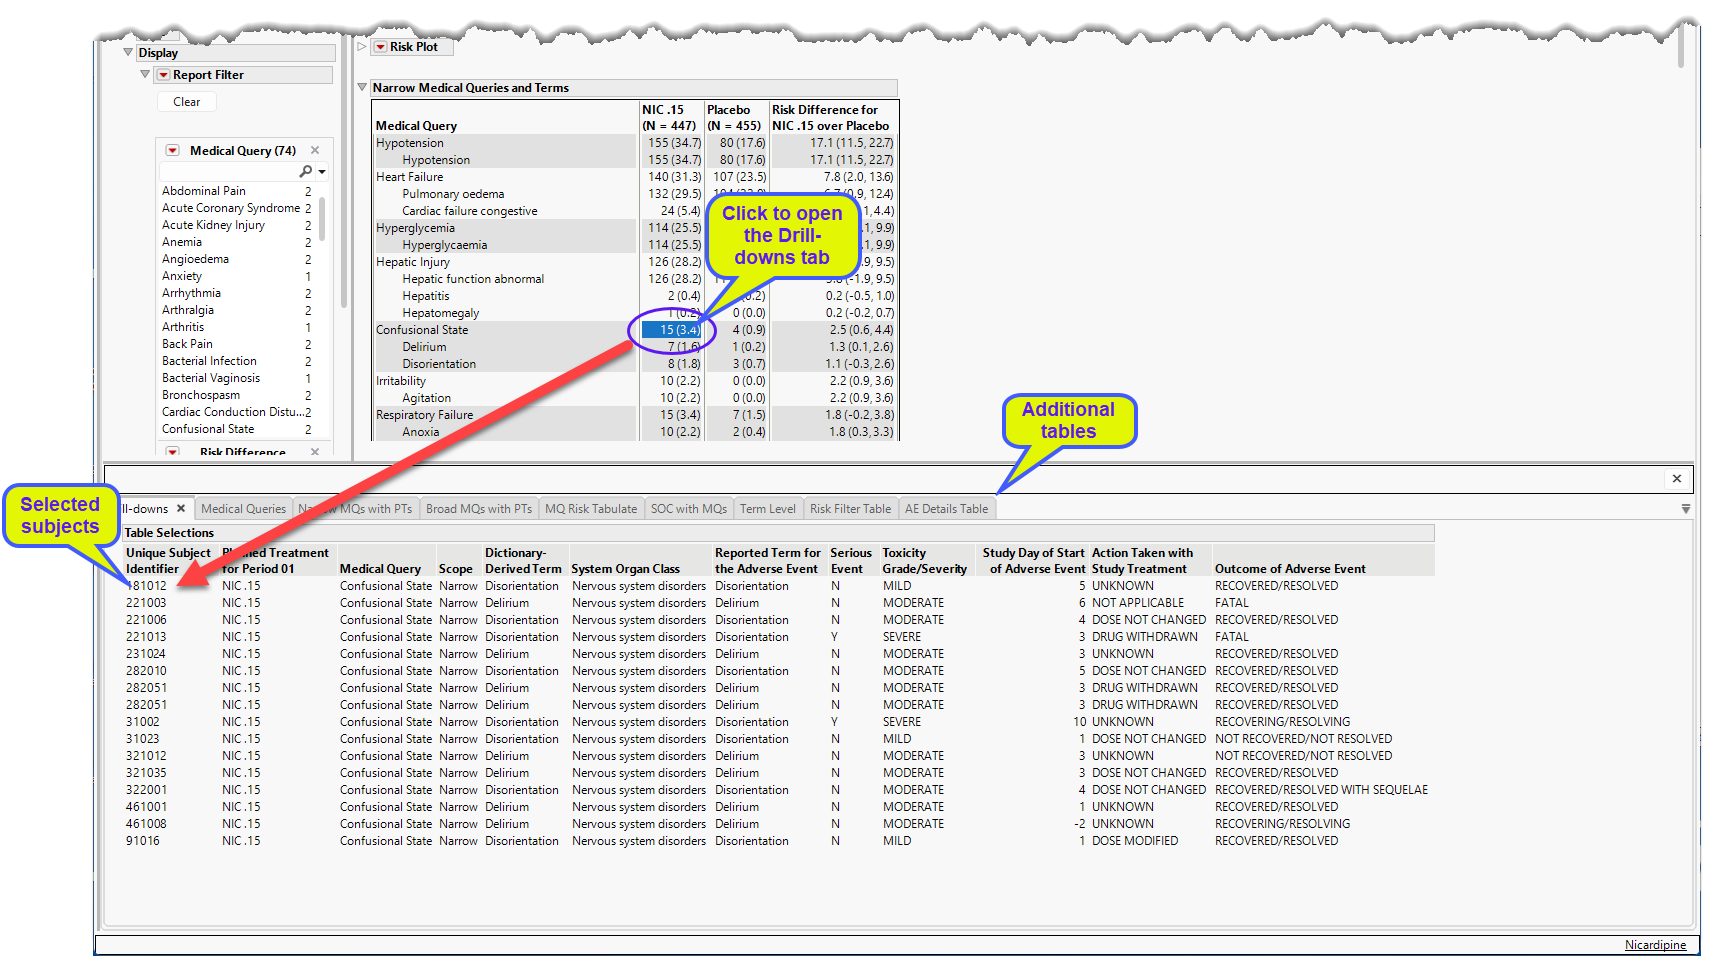
Narrow Medical Queries and Terms
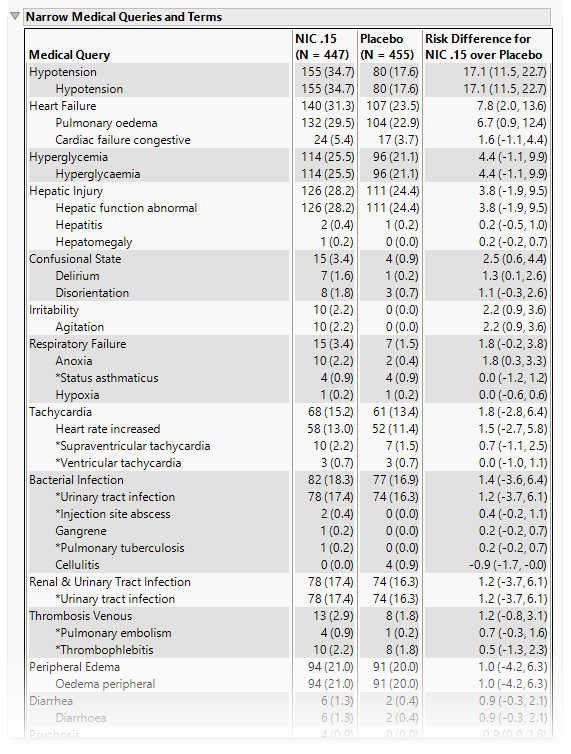
This table lists each narrow query with its associated dictionary-derived terms, the number (percent) of subjects exhibiting the event, and the risk difference between the treatment arms.
Broad Medical Queries and Terms
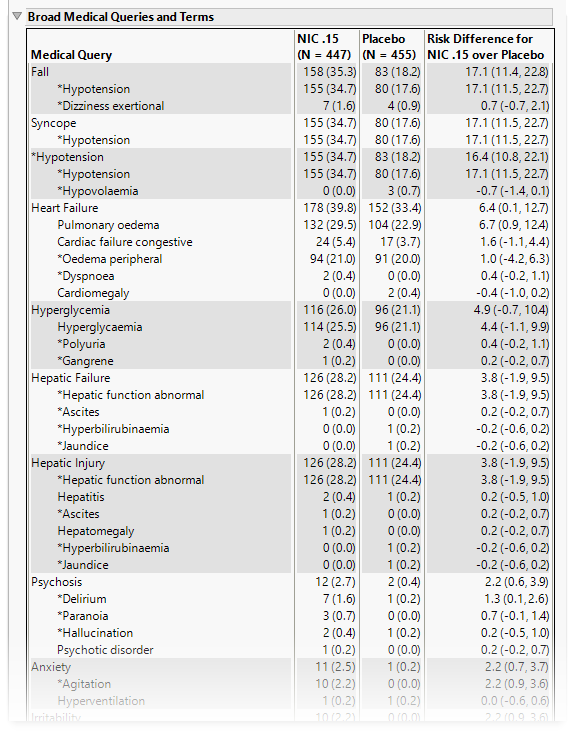
This table lists each broad query with its associated dictionary-derived terms, the number (percent) of subjects exhibiting the event, and the risk difference between the treatment arms.
Medical Queries
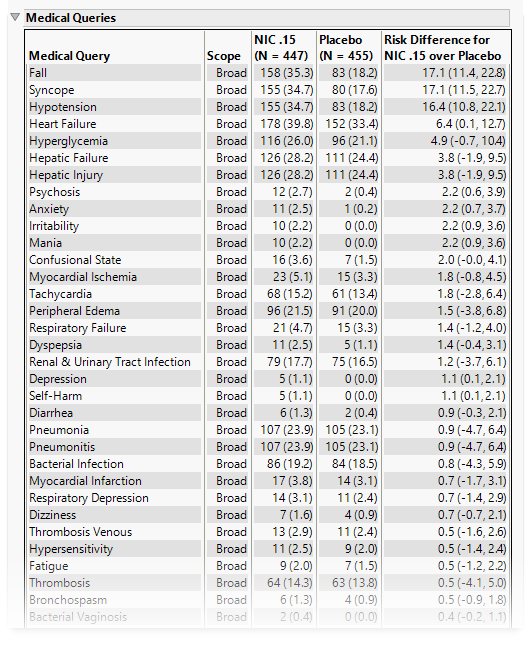
This table summarizes each query without the associated dictionary-derived terms for the number (percent) of subjects exhibiting the event, and the risk difference between the treatment arms.
System Organ Class
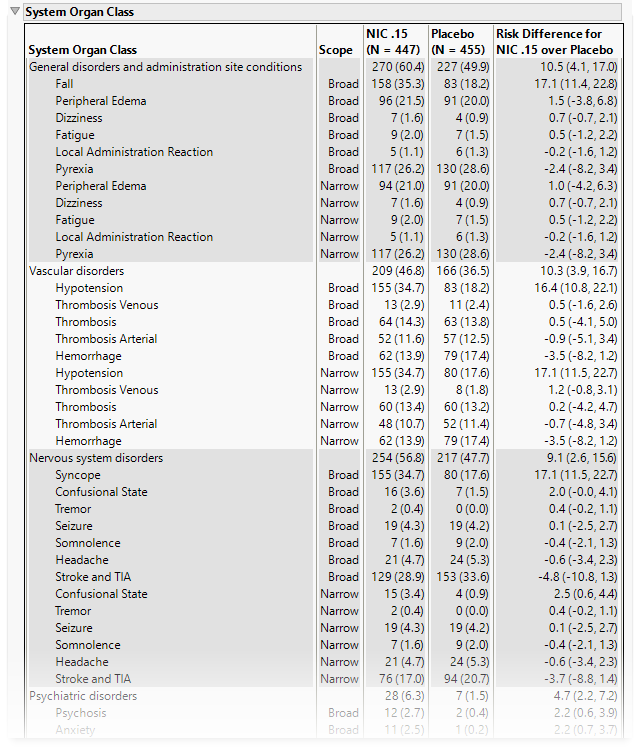
This table lists the number (percent) of subjects exhibiting each SOC and the risk difference between the treatment arms.
Note: When SMQs are selected, SOCs are those contained in the AEBODSYS column from either AE or ADAE. Alternatively, when OCMQs are selected, the SOCs are those matched to the OCMQ in the OCMQ References tab of the Excel file.
You can click on the subjects displaying specific events described by the medical queries to bring up the Drill-downs tab that provides more details about the specific subjects and medical query along with several additional tables with more details.
Options
Data
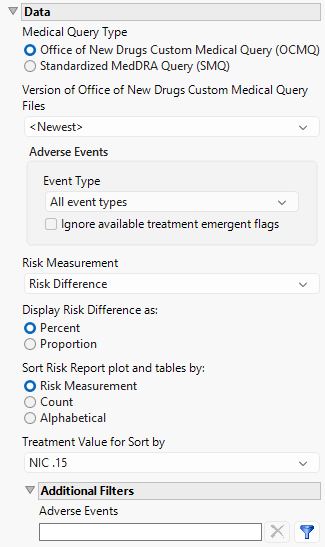
Medical Query Type
This widget enables you to specify whether you are using the OCMQs or standard medical queries. OCMQs are used by default. Refer to Medical Query Type for more information.
Version of Office of New Drugs Custom Medical Query Files/Version of Standardized Medical Query Files
Use this widget to specify the version of the Medical Query files to use in the analysis. Options include all of the Medical Query files stored in the Medical Query directory specified for your configuration. Refer to General File Paths for information about the location of this directory. This option is dependent on the medical query type specified above.
Event Type
Analysis can consider all events or only those that emerge at specific times before, during, or after the trial period. For example, selecting On treatment events as the Event Type includes only those events that occur on or after the first dose of study drug and at or before the last dose of drug (+ the offset for end of dosing).
Ignore available treatment emergent flags
If you choose to ignore available treatment emergent flags, the analysis includes all adverse events that occur on or after day 1 of the study when the event type is Treatment emergent events.
Risk Measurement
Use the Risk Measurement option to specify the measure you want to use for defining risk.
Display Risk Difference as:
Use this widget to specify whether to display the risk difference values as either percentages or proportions.
Sort Risk Report plot and tables by:
Use the Sort Risk Report plot and tables by: widget to specify how the rows in the Risk Report plot and tables are to be sorted.
Treatment Value for Sort by
Use this widget to specify the treatment value to sort the plots and tables by. This is especially useful when there are multiple treatment regimes. Refer to Treatment Value for Sort by for more information.
Additional Filters - Adverse Events
This filter lets you restrict your analysis to only those subjects that meet specific criteria at the AE domain level. See Adverse Events for more information.
Note: To filter subjects with a specific event or finding, one could also use the Subpopulation Builder on any domain of interest. For example, filter to all subjects that exhibit cardiac failure ( :Customized Query 01 Name == "Cardiac failure" ) and run all reports on those.
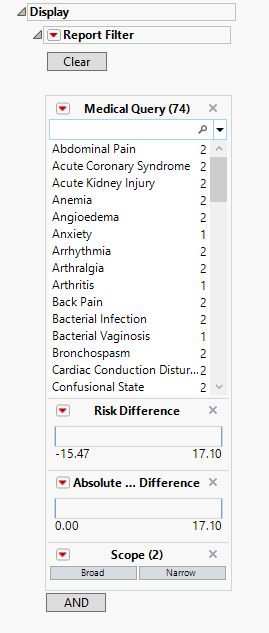
Report Data Filters
These filters enable you to subset and view subjects based on demographic characteristics and other criteria. Refer to Data Filter for more information.
General and Drill Down Buttons
Action buttons provide you with an easy way to drill down into your data. The following action buttons are generated by this report:
| • | Click  to reset all report options to default settings. to reset all report options to default settings. |
| • | Click  to view the associated data tables. Refer to Show Tables for more information. to view the associated data tables. Refer to Show Tables for more information. |
| • | Click  to generate a standardized pdf- or rtf-formatted report containing the plots and charts of selected sections. to generate a standardized pdf- or rtf-formatted report containing the plots and charts of selected sections. |
| • | Click  to generate a JMP Live report. Refer to Create Live Report for more information. to generate a JMP Live report. Refer to Create Live Report for more information. |
| • | Click  to take notes, and store them in a central location. Refer to Add Notes for more information. to take notes, and store them in a central location. Refer to Add Notes for more information. |
| • | Click  to read user-generated notes. Refer to View Notes for more information. to read user-generated notes. Refer to View Notes for more information. |
Default Settings
Refer to Set Study Preferences for default Subject Level settings.
Methodology
To run this report, at least two treatment levels are required, and the treatment control level preference must not be set to None.
Joining the OCMQ File with the Adverse Event Data Set
JMP Clinical uses the OCMQ Comments and Consolidated List tabs from the OCMQ Excel file. Data from these two tabs are imported into JMP Clinical and merged by the OCMQ name. The resulting data set is then merged with the adverse event data by the preferred term (PT), also known as the dictionary-derived term.
Joining the SMQ Files with the Adverse Event Data Set
JMP Clinical uses the smq_list, smq_content, pt, and llt ASCII files from the SMQs. Before merging with the adverse event data, inactive and child medical queries are removed from the smq_list and smq_content files by deleting records where term_status = "I", status = "I", or term_level = 0. Noncurrent terms are also removed from the llt file by deleting records where llt_currency = "N".
The ASCII files are merged by first combining smq_list and smq_content by SMQ code, then merging in the pt and llt files by PT code and LLT code, respectively. Once this SMQ mapping is complete, the resulting data set is merged with the adverse event data by PT and LLT.
Statistical Calculations
The Medical Query Risk Report calculates risk difference, relative risk, and odds ratio using the Response Screening platform in JMP. To prepare the data for this platform, a table is created with one row per subject and one column per medical query. Each medical query column is assigned a value of 1 if the query occurred for a subject and 0 if it did not.
These medical query columns are specified in the Y, Response role, and the treatment variable is specified in the X role. The calculated values for risk difference, relative risk, and odds ratio, along with their 95% confidence intervals, are saved from the 2 by M Results table. Confidence intervals are calculated using JMP's Response Screening report. See Response Screening Report Tables for more information.
Additional information on the Response Screening platform and the resulting statistics can be found at: https://www.jmp.com/support/help/en/19.1/?os=win&source=application#page/jmp/response-screening.shtml#.