Pareto Plot
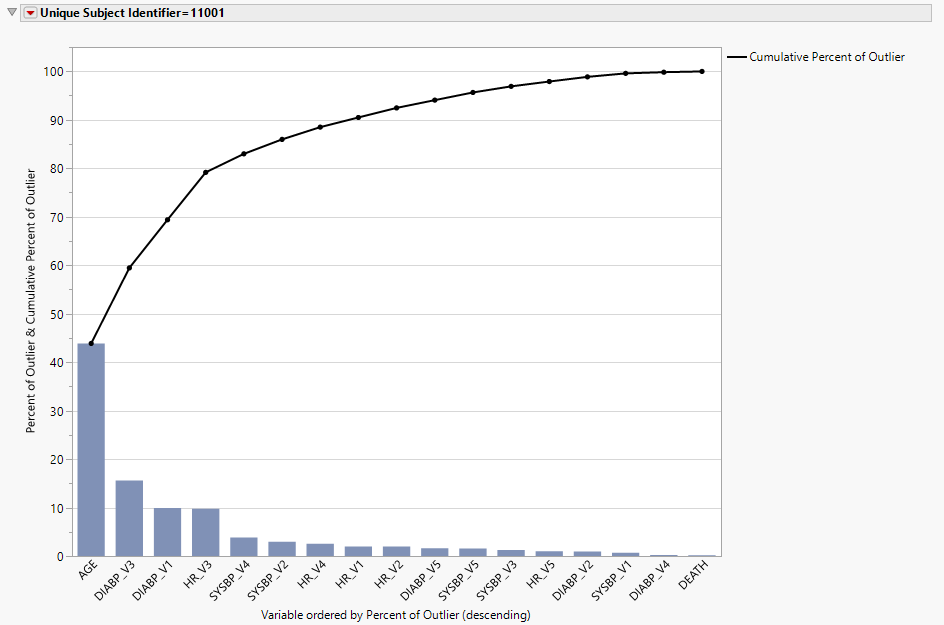
A Pareto plot displays categories of issues or events sorted from most common to least common, typically accompanied by a cumulative percentage line. It is based on the Pareto principle (80/20 rule) - the idea that a small number of categories often account for the majority of issues. Pareto plots can be particularly useful in clinical trials to support attention to the most impactful data issues or safety signals, such as, identifying the most frequent AEs in a study, the protocol deviation types that occur most often, or outliers that may be present.
See JMP's Pareto Plots documentation for more information.