Concomitant Medication Protocol Compliance
Medical doctors must evaluate all medications provided to participants in a clinical trial. In following the approved study plan (protocol) it is often necessary to evaluate whether any participants taking concomitant medications took these medications in a time window which is restricted or simply disallowed. Often times these are defined by inclusion or exclusion criteria involving a specific number of days before and/or after a particular visit. Frequently, clinical trials will disallow medications taken for a specific indication within 90 days of the baseline visit. The Concomitant Medication Protocol Compliance report has been designed to help identify these types of issues by allowing doctors to set the time window ranges based on a single visit or two visits defined by the protocol.
Note: This report does not respond to the Review Subject Filter.
Report Results Description
Running this report for a given studies’ Concomitant Medications (CM) and Subject Visits (SV) domains using default settings generates the report shown below.
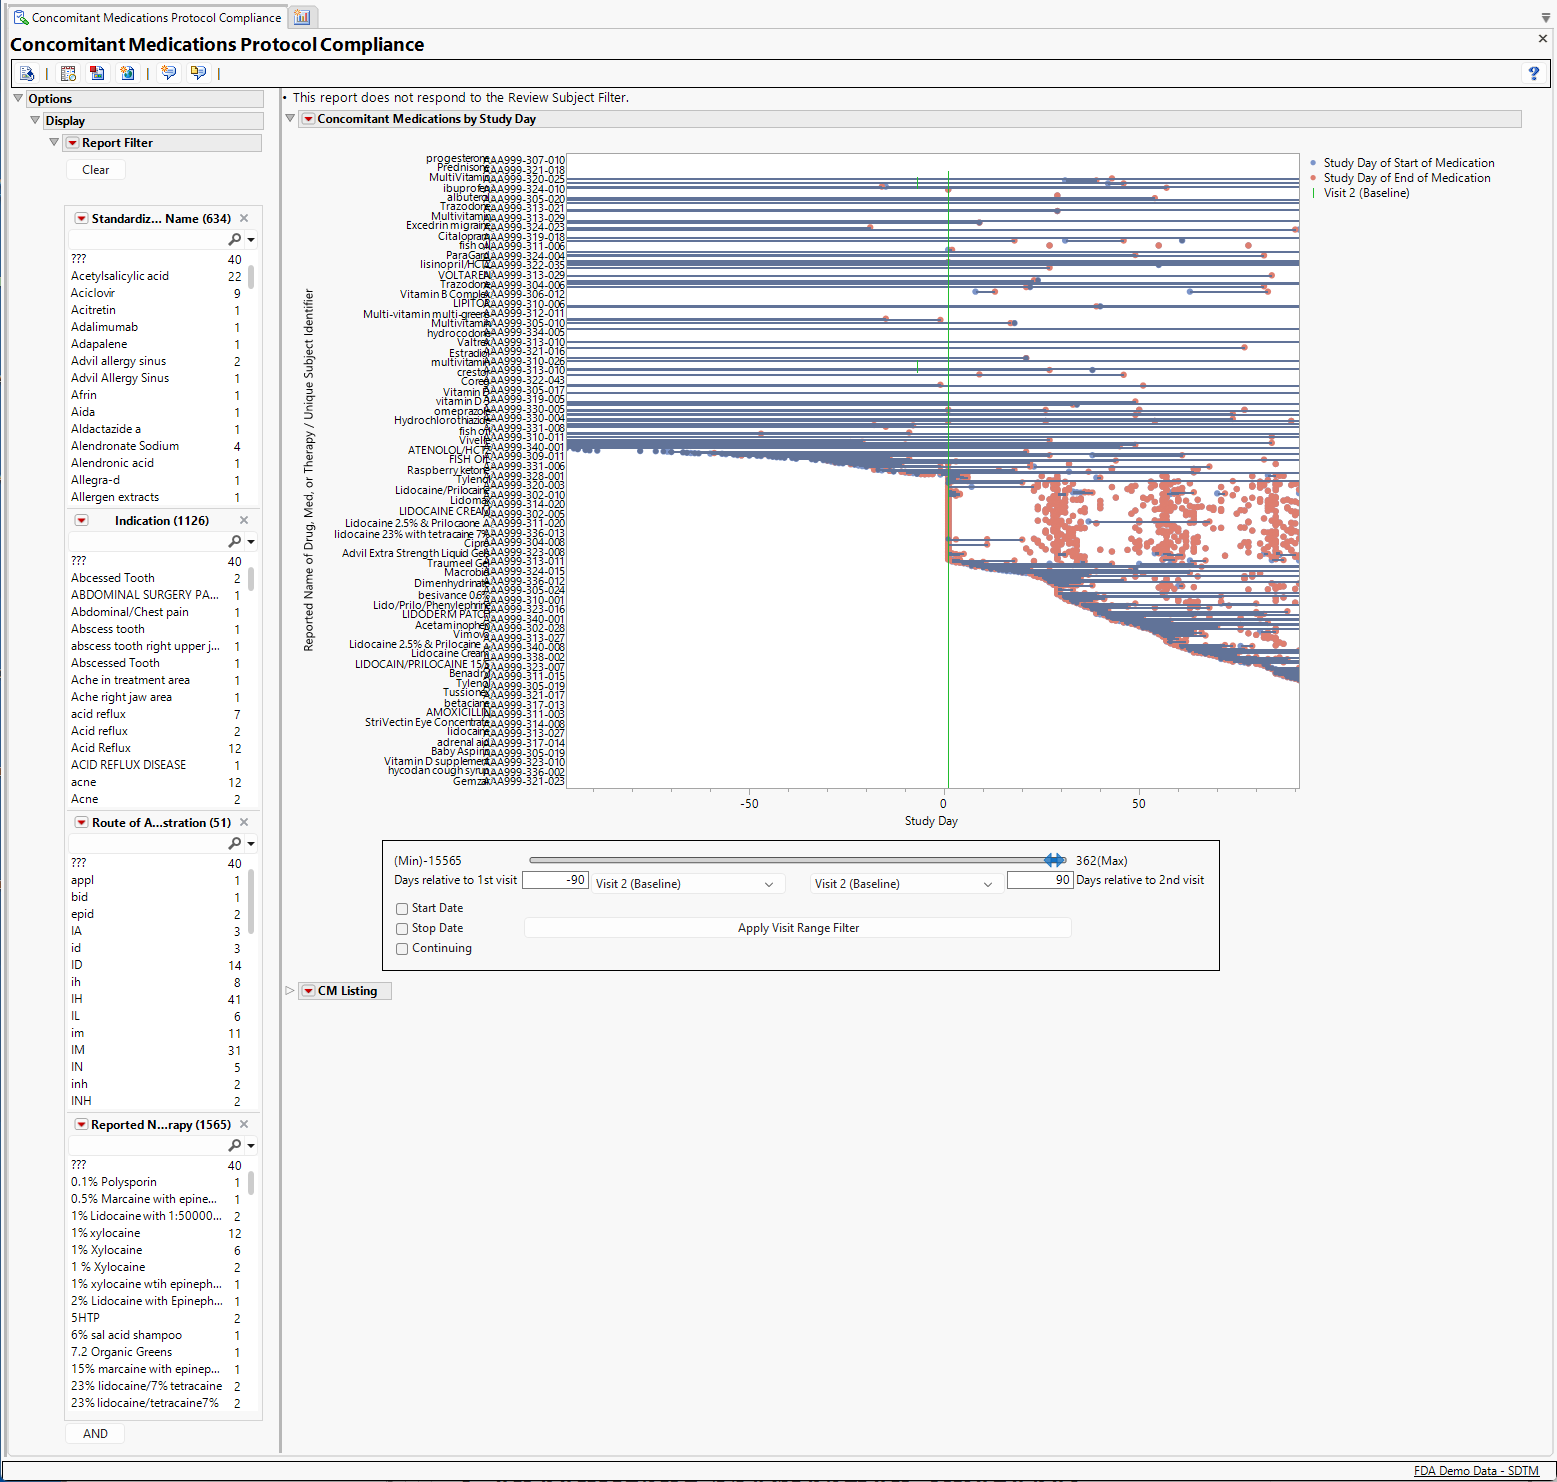
The report contains the following elements:
Concomitant Medications by Study Day
This section includes a plot showing all of the drugs, not including the treatment under investigation, subjects received before and during the study that subjects and the range of they received them. Each line in the graph represents one drug received by one patient. By default, the time range displayed runs between ninety days prior to the study's baseline visit(typically Visit 2) and ninety days after that visit.
The Report Filter enables you to focus on the reported name for drugs, their class, ATC Code or indications for identifying specific subjects for exclusion. For example, suppose that the trial design required that subjects taking insulin within 90 days before or after the baseline visit were to be excluded from the study. By selecting insulin in the medication list, we discover that three subjects were identified as having taken insulin.
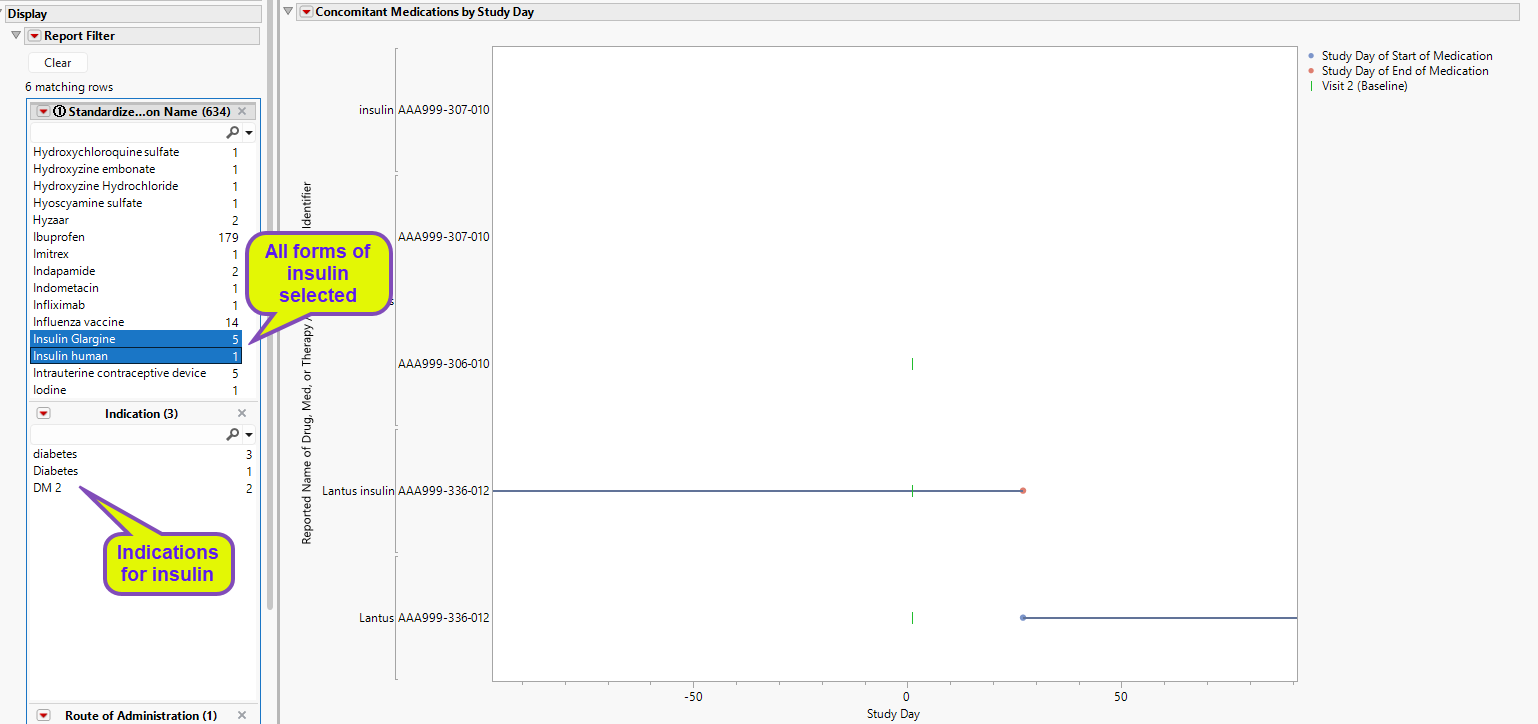
One subject (AAA000-336-012) received insulin throughout the study period, switching between forms between days 20 and 30.
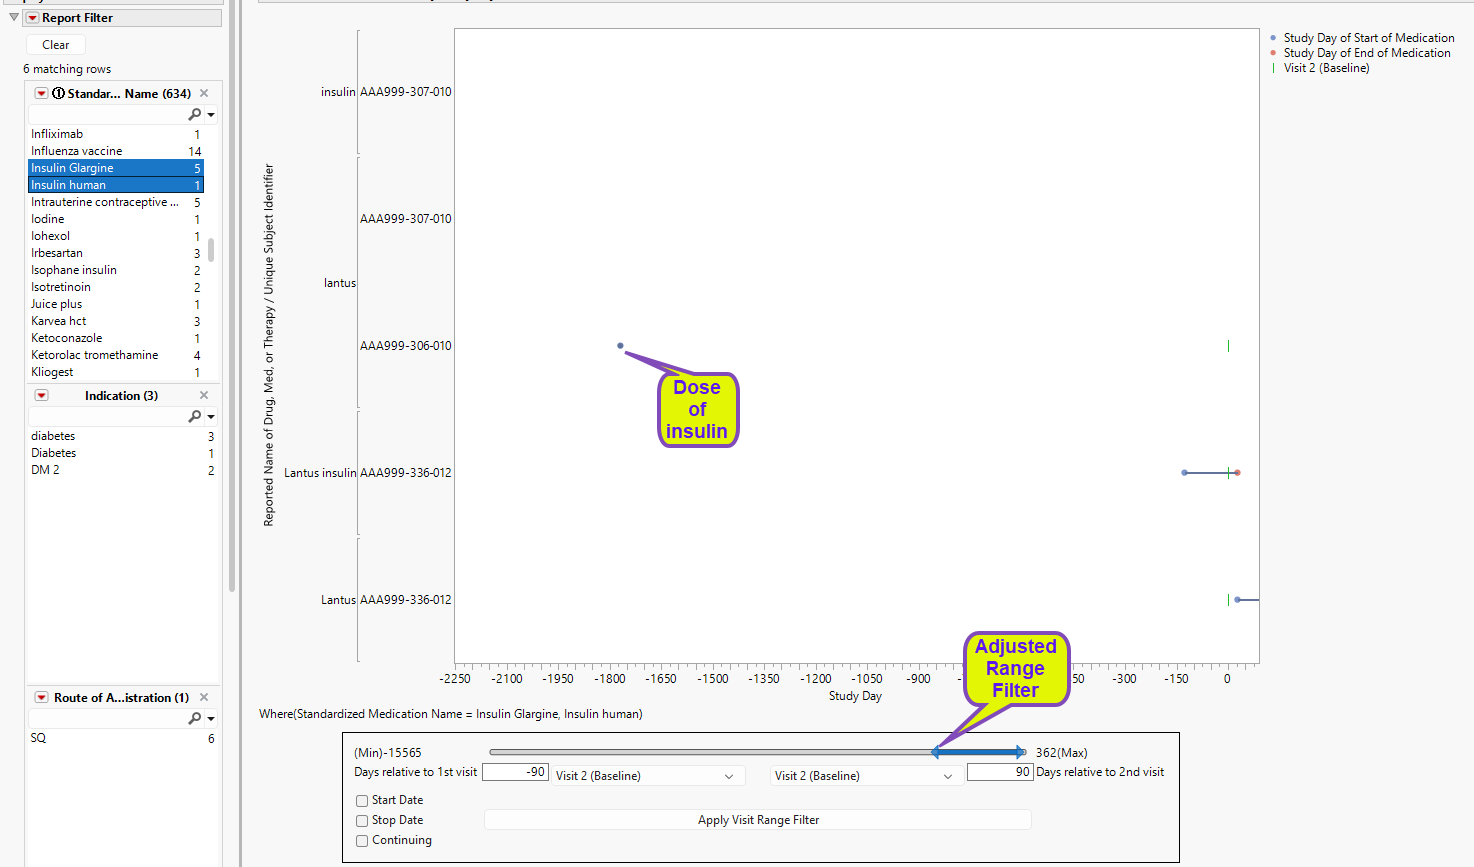
The other two subjects (AAA999-307-010 and AAA-306-010) were flagged even though they showed no reported use of insulin during the study period. In these cases, insulin use occurred and ended long before the beginning of the study. For example, using the Visit Range Filter, we see that subject AAA-306-010 reported the last insulin use occurred ~1800 days prior to the start of the study.
Report Filter
By default, the Report Filter enables you to screen subjects by disease indication, route of medication administration. Additional criteria can be added by clicking . See Data Filter for more information.
Visit Range Filter
The Visit Range Filter enables you to set the time window for screening for concomitant medication compliance. Use the slider to extend or contract the window. Set specific visits, start and end dates (relative to specified visits) and continuing for the medications (within the selected visit range). Once the range settings have been specified, click to apply the changes. Once clicked, changes to . Click to reset the Visit Range Filter.
Changing any selections within the Visit Range Filter will clear the previous visit range filter. For the new selections to be applied, click .
Note: Any medications missing an end date are considered to be continuing.
If no subjects meet the selected filter criteria, a note indicating that "No Medications meet the selected criteria" is surfaced instead of the plot and table.
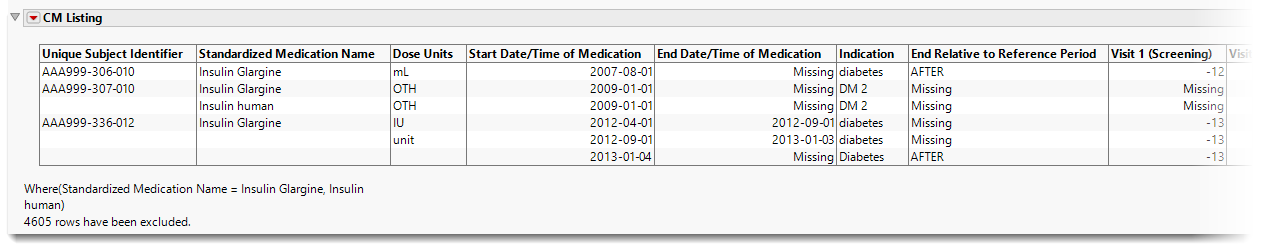
CM Listing
This interactive table lists all the concomitant medications reported by all of the subjects, with start and end dates (both absolute and relative to the reference period), dosages, and indications. The study day of each visit is also listed. This table is responsive to the report filter, showing only the subjects and medications meeting the filter criteria.
The table contains the following columns, by default:
| • | Unique Subject Identifier |
| • | Reference ID |
| • | Reported Name of Drug, Med, or Therapy |
| • | Standardized Medication Name |
| • | Total Daily Dose |
| • | Dose Units |
| • | Dose per Administration |
| • | Start Date/Time of Medication |
| • | End Date/Time of Medication |
| • | Category for Medication |
| • | Subcategory for Medication |
| • | Indication |
| • | Medication Class |
| • | Epoch |
| • | Visit Name |
Note: Study day 1 is determined by the study dates and/or study days for the baseline visit (usually Visit 2).
General and Drill Down Buttons
Action buttons provide you with an easy way to drill down into your data. The following action buttons are generated by this report:
| • | Click  to reset all report options to default settings. to reset all report options to default settings. |
| • | Click  to view the associated data tables. Refer to Show Tables for more information. to view the associated data tables. Refer to Show Tables for more information. |
| • | Click  to generate a standardized pdf- or rtf-formatted report containing the plots and charts of selected sections. to generate a standardized pdf- or rtf-formatted report containing the plots and charts of selected sections. |
| • | Click  to generate a JMP Live report. Refer to Create Live Report for more information. to generate a JMP Live report. Refer to Create Live Report for more information. |
| • | Click  to take notes, and store them in a central location. Refer to Add Notes for more information. to take notes, and store them in a central location. Refer to Add Notes for more information. |
| • | Click  to read user-generated notes. Refer to View Notes for more information. to read user-generated notes. Refer to View Notes for more information. |
Methodology
No testing is performed. There are blue points drawn at the start day of each medication as well as a red point on the end day, with a blue line drawn between these points. If it seems there is only a red dot on the screen with no line then the start day and stop day are probably on the same day and mousing over the point will display both values. If the concomitant medication data has a “end relative to reference period” value of “ongoing” or “continuing”, then there may be no end date for the drug and the line will continue to the end of the graph.