Findings Box Plots
This report displays the box plots by treatment group representing the change from baseline in measurements for each test for specified findings domain across various times or points in the study. Times can be specified using a list of bracketed times or, alternatively, a number of times can be set to create times that span across the entire study.
If the variable xxBLCHG (where xx is substituted with the chosen domain 2 letter code) exists, this variable is used in plotting change from baseline. Otherwise, a measurement is determined to be a baseline measurement by the ABLFL or xxBLFL variable where xx is substituted with the 2-letter code for the chosen domain for analysis. If this variable does not exist, baseline is calculated from measurements taken on or before day 1 of the study. A time can be specified to determine baseline measurements.
Note: JMP Clinical uses a special protocol for data including non-unique Findings test names. Refer to How does JMP Clinical handle non-unique Findings test names? for more information.
Report Results Description
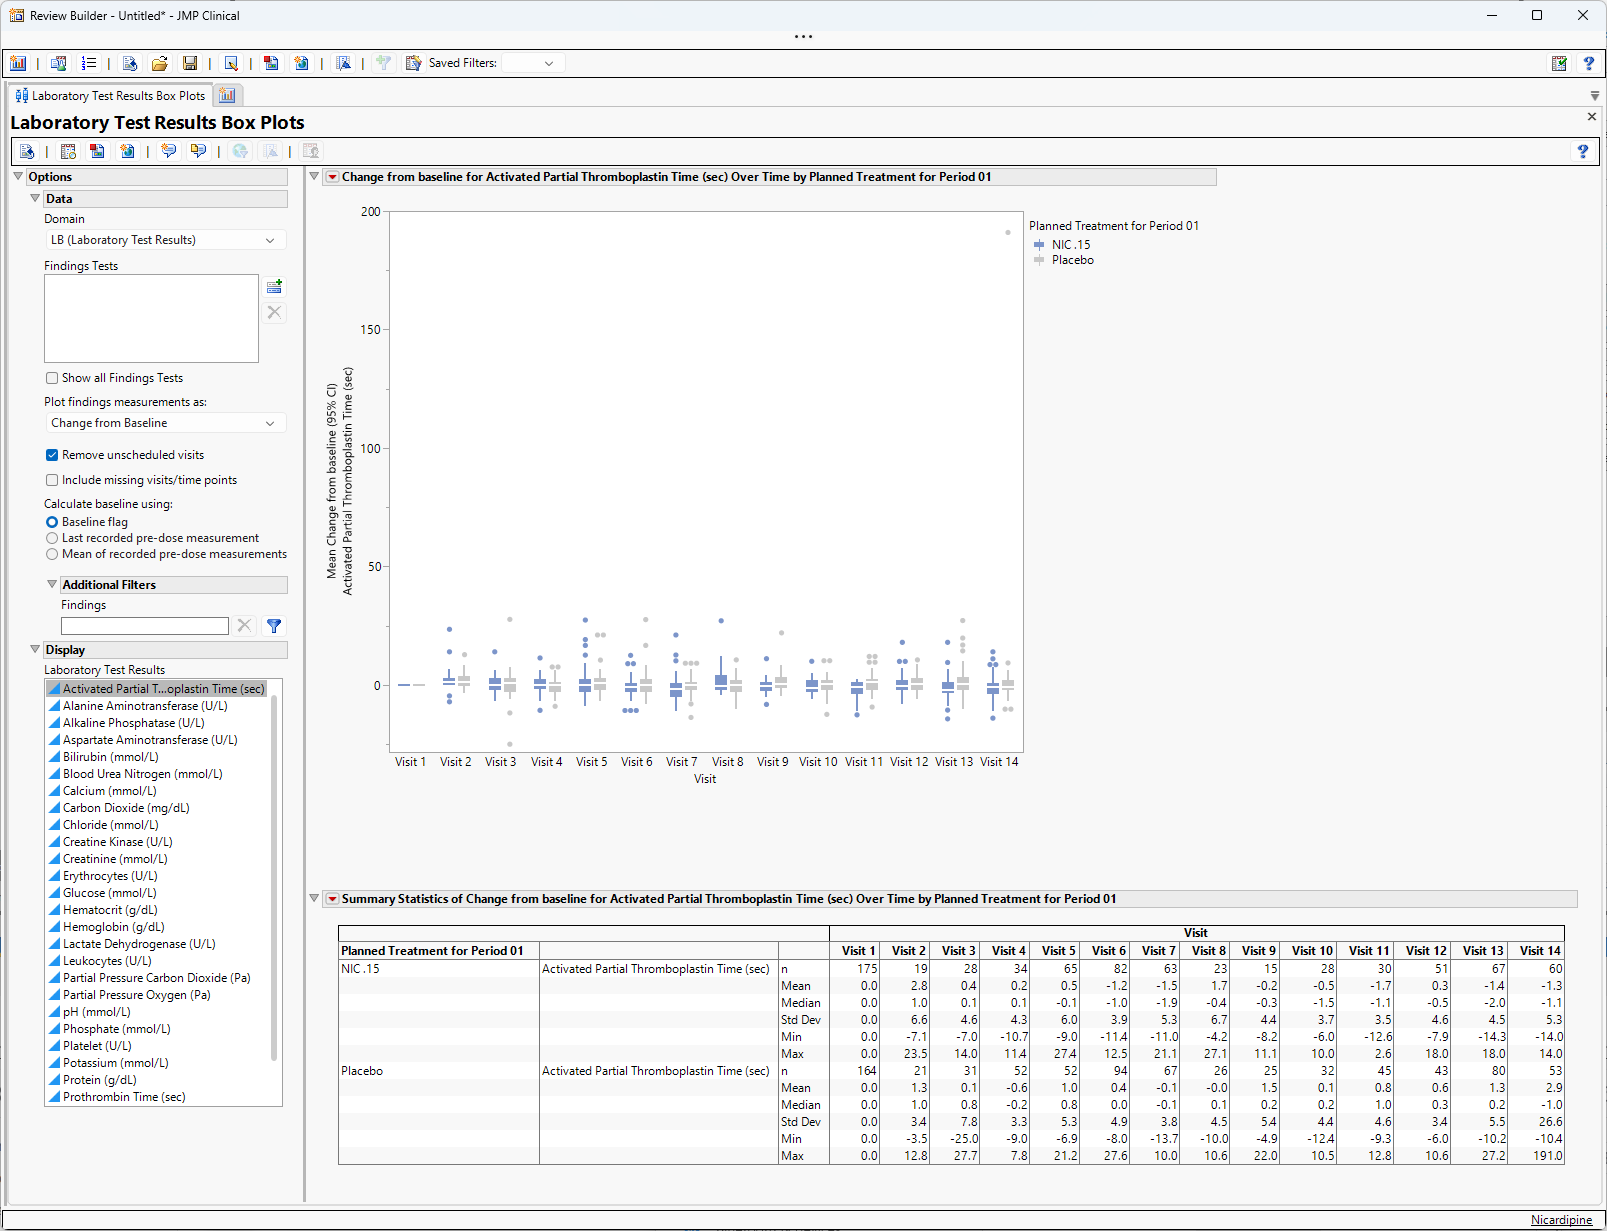
Running Findings Box Plots for Nicardipine using default settings generates the report shown above. Output from the report is organized into sections. Each section contains one or more plots, data panels, data filters, or other elements that facilitate your analysis.
Box Plots display values chosen in the Plot findings measurements as: option. Findings results (LB, VS, or EG) displayed depend on the domain selected using the Domain option. Use the column switcher to the left of the plots to select the findings test results to display.
Each box plot set represents an xxTESTCD from the selected domain. For example, in the graph above, the first figure represents the change from baseline for APTT (Activated Partial Thromboplastin Time) at each visit for both treatment arms. The table presents the associated statistics.
You may notice a difference in baseline vital signs results between JMP Clinical v8.1 and v19. This can happen when the baseline calculation is for the mean of recorded predose measurements for findings that have "Y" as a value for VSBLFL if some of those rows are missing a value for VSDY. v8.1 computes the mean for all rows that have a value of "Y" as a value for VSBLFL, regardless of the value of VSDY. v19 ignores any rows lacking a value for VSDY and computes baseline means using just the rows that both have a value of "Y" as a value for VSBLFL, and some value for VSDY.
A table summarizing the statistics of the specified finding(s) from baseline across visits is shown at the bottom of the report. In this table, n represents the number of subjects at each visit.
Options
Data
Domain
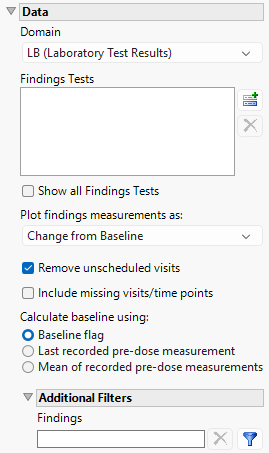
Use this widget to specify whether to plot the distribution of measurements from either the Electrocardiogram (EG), Laboratory (LB), or Vital Signs (VS) findings domains.
Findings Tests
Use this widget to select specific Findings tests.
| 8 | Click  to open the Add window (shown below) that lists available test names (shown below). to open the Add window (shown below) that lists available test names (shown below). |
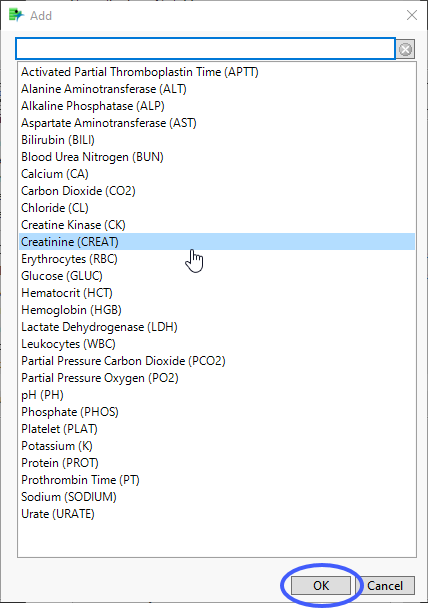
| 8 | Select the desired test(s) and click to add them to the text box. |
Show all Findings Tests
Check this box will show all the graphs for every findings tests instead of one graph with a column switcher.
Plot findings measurements as:
Use this widget to specify whether to plot the results either as observed or how they relate to the baseline measurement. Refer to Plot findings measurements as: for more information.
Remove unscheduled visits
You might or might not want to include unscheduled visits when you are analyzing findings by visit. Check the Remove unscheduled visits to exclude unscheduled visits.
Include missing visits/time points
Check the box to include missing visits/time points in both the box plot and the summary table.
Calculate baseline using:
Use the widget to specify how the baseline is to be calculated. Refer to Calculate baseline using: for more information.
Snapshot Records to Include
Use this widget to specify which updated snapshot records to include in your analysis. This option is surfaced only in studies where the number of snapshots is greater than 0.
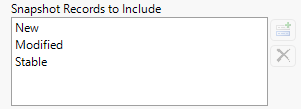
The default state of this option is to show new, modified and stable - effectively all - snapshot records. To see specific records you must remove undesired records from the analysis. For example, to surface only the new records, select both Modified and Stable and click  . Click
  to restore deleted records.
Note: JMP Clinical now relies on the JMP Compare Data Tables platform to detect new records. When duplicate rows appear, the platform evaluates them based on their row order. As a result, records are no longer labeled as Non‑Unique or Previously Non‑Unique, and the corresponding options to include those records have been removed.
Additional Filters - Findings
This filter lets you restrict your analysis to only those subjects that meet specific criteria at the level of the specified Findings domain (EG, LB, or VS). See Findings for more information.
Note: To filter subjects with a specific event or finding, one could also use the Subpopulation Builder on any domain of interest. For example, filter to all subjects that exhibit cardiac failure ( :Customized Query 01 Name == "Cardiac failure" ) and run all reports on those.
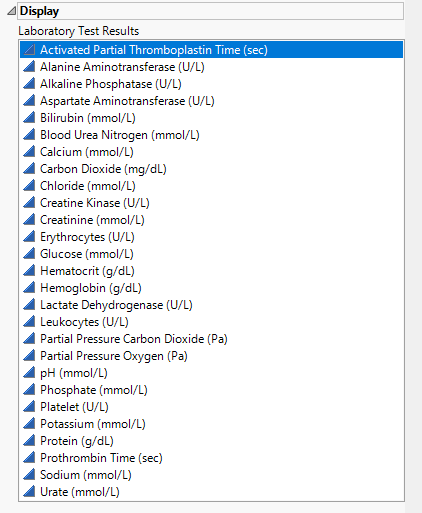
Display
Laboratory Test Results
Highlight the Findings test you want to display.
General and Drill Down Buttons
Action buttons provide you with an easy way to drill down into your data. The following action buttons are generated by this report:
| • | Click  to rerun the report using default settings. to rerun the report using default settings. |
| • | Click  to view the associated data tables. Refer to Show Tables for more information. to view the associated data tables. Refer to Show Tables for more information. |
| • | Click  to generate a standardized pdf- or rtf-formatted report containing the plots and charts of selected sections. to generate a standardized pdf- or rtf-formatted report containing the plots and charts of selected sections. |
| • | Click  to generate a JMP Live report. Refer to Create Live Report for more information. to generate a JMP Live report. Refer to Create Live Report for more information. |
| • | Click  to take notes, and store them in a central location. Refer to Add Notes for more information. to take notes, and store them in a central location. Refer to Add Notes for more information. |
| • | Click  to read user-generated notes. Refer to View Notes for more information. to read user-generated notes. Refer to View Notes for more information. |
| • | Select one or more subjects, then click  to apply the Review Subject Filter and filter all reports in the review builder on the selected subjects. to apply the Review Subject Filter and filter all reports in the review builder on the selected subjects. |
| • | Select a group of subjects and click  to specify Derived Population Flags that enable you to distinguish the selected group of subjects from the general population based on their meeting specific criteria. to specify Derived Population Flags that enable you to distinguish the selected group of subjects from the general population based on their meeting specific criteria. |
| • | Select one or more points (from the same visit or different visits) on the box plot and click  to surface a table listing the findings results for the selected subject(s) from the selected visit(s). to surface a table listing the findings results for the selected subject(s) from the selected visit(s). |
Default Settings
Refer to Set Study Preferences for default Subject Level settings.
Methodology
Counts of subjects with findings results are tabulated for each visit. Mean, median, standard deviation, minimum and maximum values are computed for selected findings test for each visit.