Events Risk Report
This report screens all events from the specified domain and calculates and generates forest plots of risk differences, relative risks or odds ratios. It reports each subject only once per event regardless of how many incidents of the event occur.
Note: This report should be considered as multiple reports; for example, DS Risk Report, CE Risk Report, or MH Risk Report, depending on which domain is specified in the dialog.
Report Results Description
Running this report for Nicardipine using default settings for medical history (MH) generates the Report shown below.
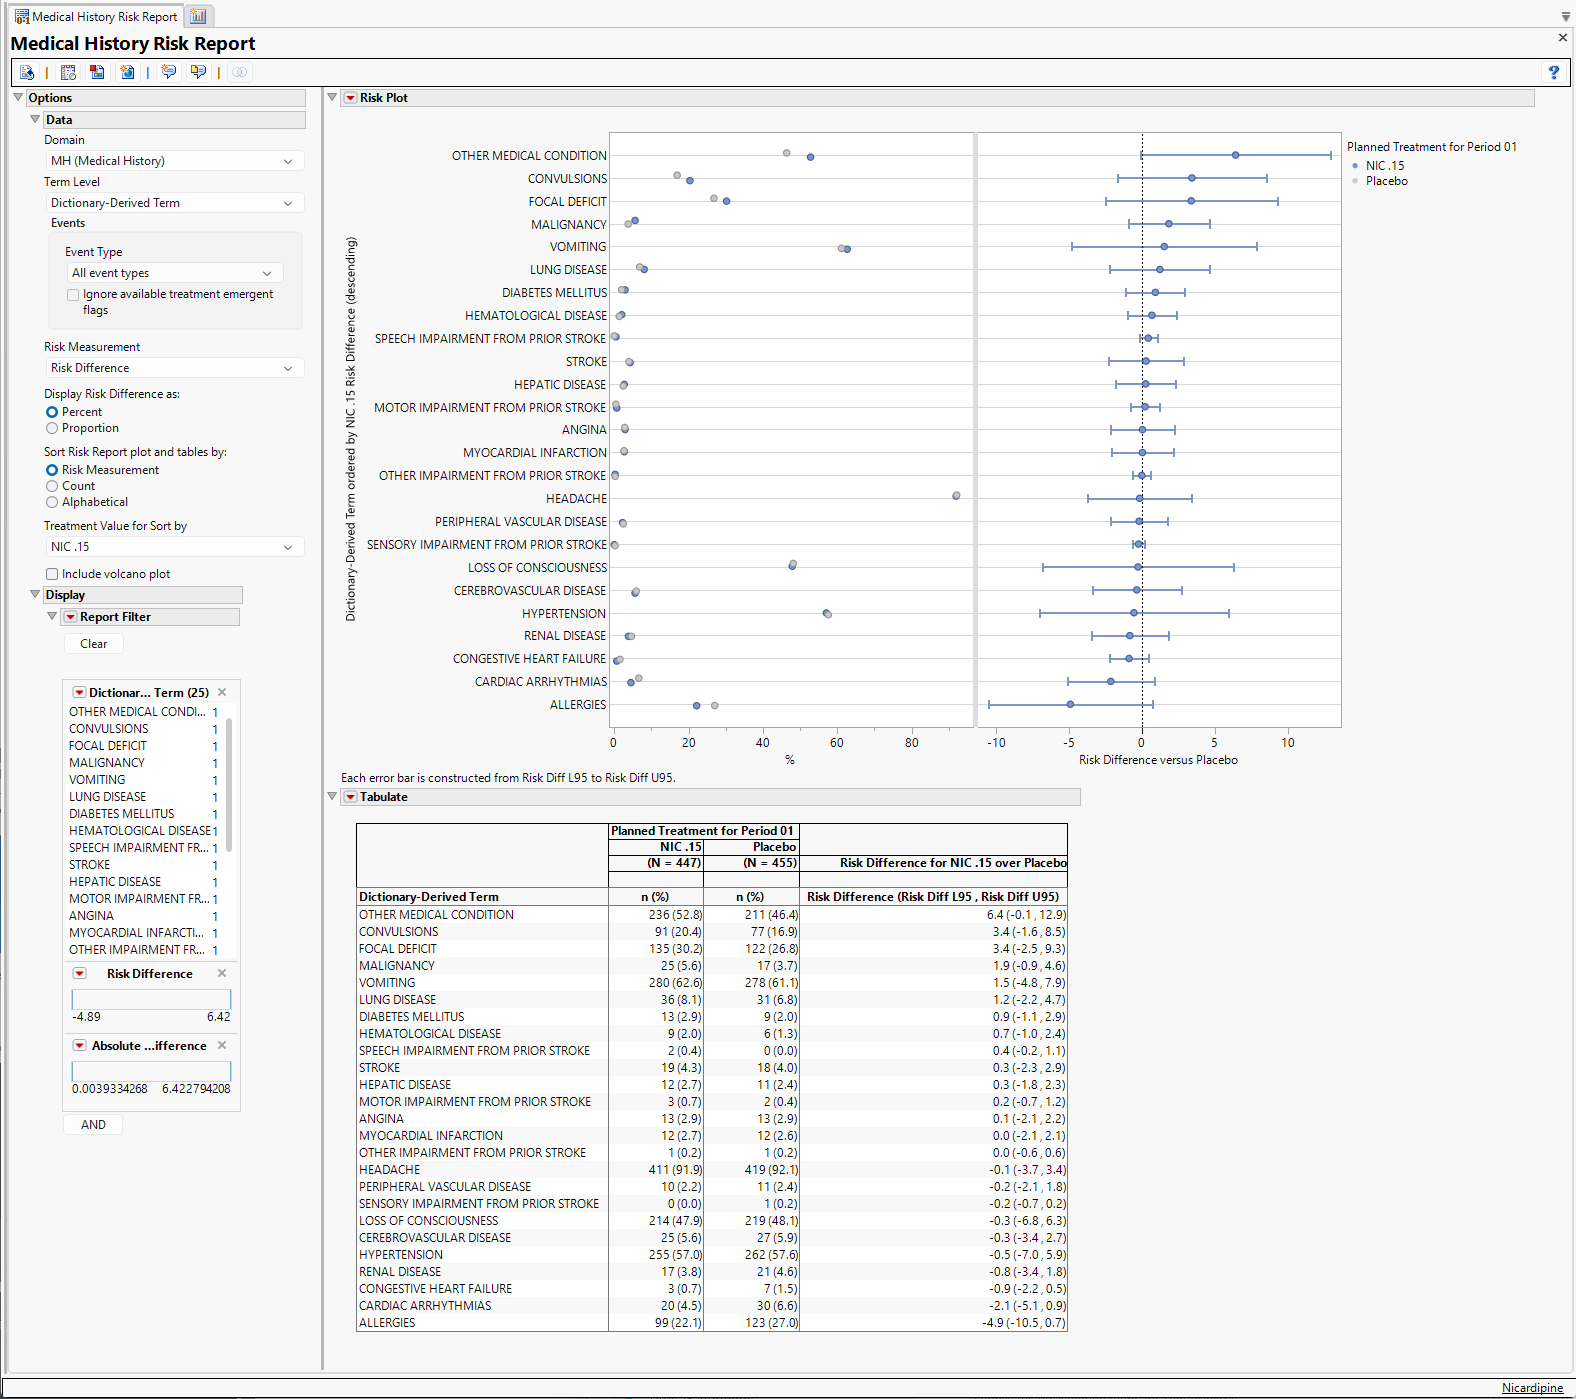
Refer to the Adverse Events Risk Report output description, keeping in mind the following important report differences in contrast with the example:
| • | Output (including section names) reflects other event incidence corresponding to selected domain (e.g. Medical History, Clinical Events), rather than adverse events incidence. |
| • | Term Level is allowed to equal Category (such as MHCAT or CECAT, depending on the domain). |
Note: The following notes: Multiple treatment periods have been detected and displayed. and Pre-treatment has been assigned to period=0. are inserted at the top of the report when these events are detected in your data.
Options
Data
Use the widgets on this panel to customize your analysis.
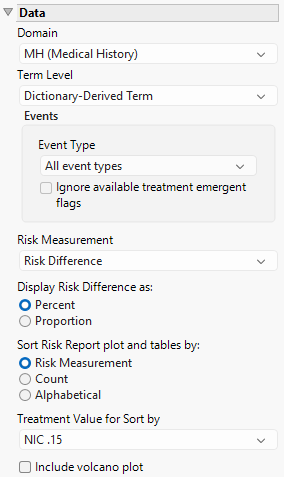
Domain
Use the Domain option to specify the event domain (DS, CE, or MH, for example) of interest.
Term Level
Term Levels are determined by the coding dictionary for the Event domain of interest, typically these levels follow the MedDRA dictionary. Use this widget to specify how each adverse event is named and the level at which the event is considered. For example, selecting Reported Term for the Medical History reports the event specified by the actual event term as reported in the MH domain. Refer to Term Level for more information.
Event Type
Analysis can consider all events or only those that emerge at specific times before, during, or after the trial period. For example, selecting On treatment events as the Event Type includes only those events that occur on or after the first dose of study drug and at or before the last dose of drug (+ the offset for end of dosing).
Ignore available treatment emergent flags
If you choose to ignore available treatment emergent flags, the analysis includes all adverse events that occur on or after day 1 of the study.
Risk Measurement
You have the option of calculating either the Risk Difference, the Relative Risk, or the Odds Ratio as the Risk Measurement. Note: When you select either Relative Risk or Odds Ratio as the Risk Measurement, the scale on the x-axis of the Forest plot changes from linear to a log scale.
Display Risk Difference as:
Use this widget to specify the difference between the risk of an event in the treatment arm and the control arm as either a percentage or a proportion of the total subject population. This widget appears only when you select Risk Difference as the Risk Measurement.
Sort Risk Report plot and tables by:
Use the Sort Risk Report plot and tables by: widget to specify how the rows in the Risk Report plot and tables are to be sorted.
Treatment Value for Sort by
Use this widget to specify the treatment value to sort the plots and tables by. This is especially useful when there are multiple treatment regimes. Refer to Treatment Value for Sort by for more information.
Include volcano plot
Check the Include volcano plot box to include a volcano plot in the report.
Alpha
The Alpha option is used to specify the significance level by which to judge the validity of the missing findings data generated by this report. The meaning of alpha depends on the adjustment method that you select. Alpha can be set to any number between 0 and 1, but is most typically set at 0.001, 0.01, 0.05, or 0.10. The higher the alpha, the higher the error rate but also higher the power for detecting significant differences. You will need to decide on the best trade-off for your experiment. This option is surfaced only when the Include volcano plot box is checked.
Display
Report Data Filters
These filters enable you to subset and view subjects based on demographic characteristics and other criteria. Refer to Data Filter for more information.
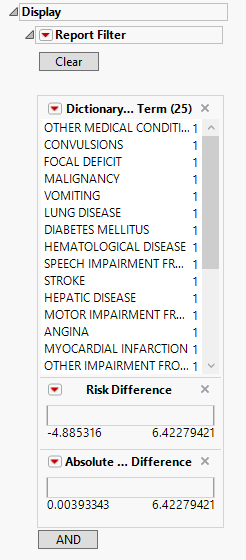
Note: Filter specifications are reapplied when any widget options are changed.
General and Drill Down Buttons
Action buttons provide you with an easy way to drill down into your data. The following action buttons are generated by this report:
| • | Click  to reset all report options to default settings. to reset all report options to default settings. |
| • | Click  to view the associated data tables. Refer to Show Tables for more information. to view the associated data tables. Refer to Show Tables for more information. |
| • | Click  to generate a standardized pdf- or rtf-formatted report containing the plots and charts of selected sections. to generate a standardized pdf- or rtf-formatted report containing the plots and charts of selected sections. |
| • | Click  to generate a JMP Live report. Refer to Create Live Report for more information. to generate a JMP Live report. Refer to Create Live Report for more information. |
| • | Click  to take notes, and store them in a central location. Refer to Add Notes for more information. to take notes, and store them in a central location. Refer to Add Notes for more information. |
| • | Click  to read user-generated notes. Refer to View Notes for more information. to read user-generated notes. Refer to View Notes for more information. |
Default Settings
Refer to Set Study Preferences for default Subject Level settings.
Methodology
Subjects are assessed for each event they experience and Percent Occurrence and Risk Difference are calculated for each event by treatment group. Percent Occurrence is simply the percentage of subjects in a treatment group who experience the event at least once during the trial period. Risk difference is calculated by subtracting the proportion of subjects exhibiting the adverse event in the control group from the proportion of subjects exhibiting the event in the treatment arm. Relative Risk or Odds Ratios may also be calculated.
Confidence intervals are calculated using JMP's Response Screening report. See Response Screening Report Tables for more information.